Download
1 / 16
160 likes | 272 Views
Performance Observation of a Dense Campus Network. Date: 2014-05-11. Authors:. Abstract. This contribution describes initial results from a survey of the performance and traffic pattern of a large scale dense campus WLAN network at the National Taiwan University (NTU).

E N D
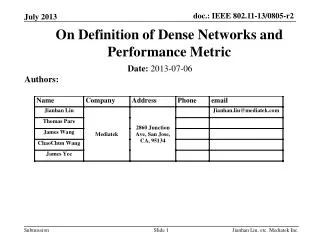
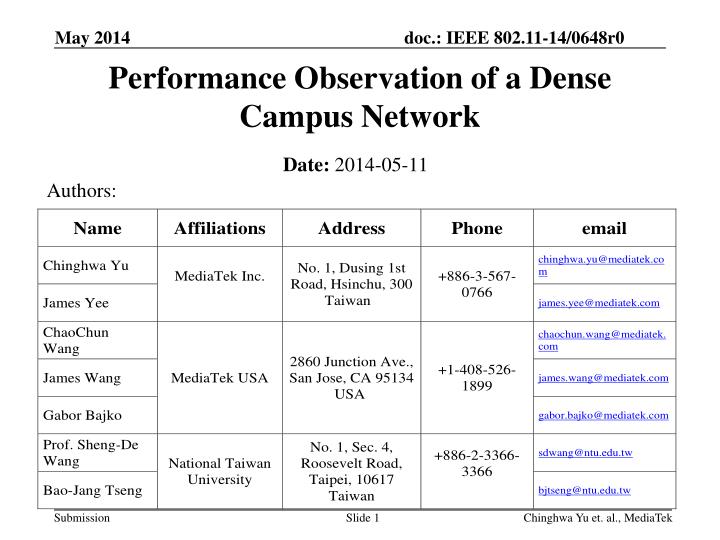
Performance Observation of a Dense Campus Network Date:2014-05-11 Authors: Chinghwa Yu et. al., MediaTek
Abstract • This contribution describes initial results from a survey of the performance and traffic pattern of a large scale dense campus WLAN network at the National Taiwan University (NTU). • We report real world numbers that validate some previous HEW observations on performance problems and propose some possible areas for protocol improvements within the scope of TGax. Chinghwa Yu et. al, Mediatek
Outlines • Network environment and measurement condition • WLAN performance and traffic pattern analysis • Problem with Dynamic Power Control • Problem with CCK • Conclusions Chinghwa Yu et. al, Mediatek
TGax Context and Background • The TGax PAR (11-14-0165-01) focuses on “many access points and non-AP stations in geographically limited areas” in the 2.4 GHz and 5 GHz frequency bands with “increased interference from neighboring devices” and “a variety of applications such as video, […]”. • All these characteristics are fully presented in the NTU campus network. • Previous HEW contributions, such as 11-13-0549r0, pointed out that TGax “should not invent new protocols without understanding why old protocols failed” and highlighted implementation problems such as “inappropriate TX powers”, “too many Probe Req/Resp”, etc. • We collected data illustrating previously highlighted problems and make some new observations on where TGax should look for solutions. Chinghwa Yu et. al, Mediatek
Campus Network Environment and Measurement Conditions Network location : NTU main campus, Taipei, Taiwan. Measurement period : 4/1/2014 – 4/30/2014. APs Deployed: 2537 APs, 14 AP Controllers Typical AP configuration: 802.11 a/b/g/n concurrent dual band 3x3 MIMO with 17 – 24 dBm Tx power. STA configurations : Wide spectrum of NB, tablets, smartphone devices. Number of collected samples : 3M records of STA connection events and aggregated anonymous logs. Chinghwa Yu et al, MediaTek
Network Signal Coverage and AP Density Signal coverage area: 450000 square meters. On average, one AP every 13 meters in distance. There are also numerous external AP and interference sources. Chinghwa Yu et al, MediaTek
Aggregate Network Loading Maximum simultaneous STAs : about 20000. Maximum throughput : about 1.3 Gbps, which is << Backbone capacity. Observation: backbone is not the bottleneck. Chinghwa Yu et al, MediaTek
Traffic and Protocol Analysis A typical snapshot shows HTTP and HTTPS dominate more than 60% of the network loading. Chinghwa Yu et al, MediaTek
User & Application Behavior • Due to bursty user application behavior, about 10% of the STAs will leave a BSS less than 2 minute after association, departing STAs, which trigger GTK handshake. • Some users have 2 devices, one of which typically become idle after a short time of operation and leaves the BSS instead of staying in power saving mode. • Less than 30% of STAs will stay in a BSS over 60 minutes. • Smartphone receiving notifications (E.g., Facebook and LINE) via mobile networks may trigger WLAN wakeup, scanning and association. • STAs operating as soft-APs in 2.4 GHz and 5 GHz band also introduce interference. Chinghwa Yu et al, MediaTek
Network Performance of a group of APs managed by a controller Snapshot: 388 APs shared by 1953 STAs. Average WLAN aggregate throughput is about 100 Mbps of the 1 Gbps controller backbone capacity: ~50% split between 2.4 GHz and 5 GHz. 45% HTTP traffic is video streaming. Chinghwa Yu et al, MediaTek
Spectrum Utilization and Link Performance • 2.4 GHz band link ratio • 11n HT40 : 11n HT20 : 11g : 11b ~= 0 : 2.8 : 1 : 0 • Practically no data transmitted using legacy CCK rates. • 5 GHz band link ratio • 11n HT 40 : 11n HT 20 : 11a ~= 13.9 : 1.5 : 1 • HT40 dominates. • ~70% of active STAs can attain MCS > 54 Mbps. Link SNR is good. • ~78% of active STAs attain goodput of ≤ 24 Mbps. Avg goodput < 12Mbps • high MCS ≠> high goodput Chinghwa Yu et al, MediaTek
Problem with Network Load Distribution • Measurement environment and conditions. • Three 802.11 a/bg/n concurrent dual band AP, Tx power, 17 – 24 dBm. • 15m x 15m lecture room with 100 to 150 users. • There is interference from external nearby APs. • Observed performance with and without enabling dynamic Tx Power control (DTPC), utilized for the purpose of mitigating mutual interference of APs. Chinghwa Yu et al, MediaTek
Problem with Network Load Distribution • DTPC improved the overall area throughput, but it did not evenly distribute the system load among the APs. Comparing before vs. after DTPC: • 10% overall Network throughput improvement. • 33% drop in average STA throughput. • A STA will typically associate with a higher Tx power AP. With DTPC, more STAs associated with the higher power AP must contend with one another and their average throughput degrade. • AP load balancing techniques, such as those based on 11k, 11v mechanisms, were not used. Chinghwa Yu et al, MediaTek
Problem with CCK • Measurement environment and conditions. • One 802.11 a/bg/n concurrent dual band AP. • 24 dBm Tx power, no DTPC. • 15m x 15m lecture room with 100 to 150 users. • Although legacy CCK-only devices are rarely used for data, CCK signals still impact the overall WLAN performance. • 7 CCK legacy devices are found over 2800 samples. • CCK signals are mostly generated by management frames. Chinghwa Yu et al, MediaTek
Problem with CCK • Management frames air time / Data frames air time is about 18%. • Probe request and probe response during scanning and association are the major sources of such management frames. • Why such frequent scanning and associations? • Need further investigation. Chinghwa Yu et al, MediaTek
Conclusions • In a dense managed campus network, we found that WLAN is the bottleneck (see 11-14-0637 on spatial reuse), video traffic is significant (see 11-14-0604-00-00ax on video traffic), and apps are bursty in activity. • Low average per STA throughput due to low likelihood of Channel Access, not link quality. • More than PHY improvements needed. • Dynamic Tx Power Control may improve overall area throughput but lowers average per STA throughput. • Smarter AP selection for load balancing needed. • CCK Management frames heavily impact 2.4GHz WLAN. • Need to reduce impacts of scanning and association. • Further observations and solution validation expected via NTU collaboration. Chinghwa Yu et al, MediaTek