Download
1 / 10
100 likes | 195 Views
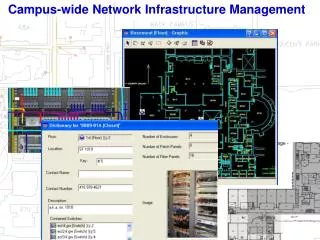
Analysis of a Campus-Wide Wireless Network. David Kotz and Kobby Essien Dartmouth College, MOBICOM ‘02. Setup. 11 week data collection during fall ‘01 476 access points covering 151 buildings 81 subnets with identical SSID. Data Collection. syslog events

E N D
Analysis of a Campus-Wide Wireless Network David Kotz and Kobby Essien Dartmouth College, MOBICOM ‘02
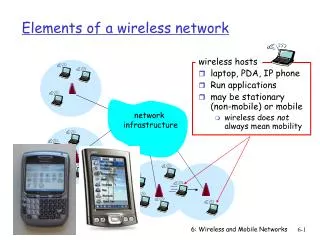
Setup • 11 week data collection during fall ‘01 • 476 access points covering 151 buildings • 81 subnets with identical SSID
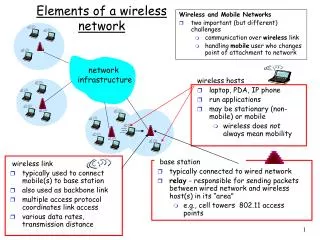
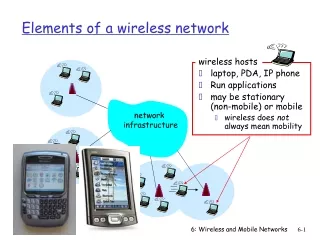
Data Collection • syslog events • Message sent to syslog server when a client card (de) authenticates and (re-,dis) associates • SNMP polling • Poll every 5 minutes returns in and outbound bytes per MAC address • tcpdump sniffers • Packet headers captured in four locations
Traffic • 3.3 terabytes of total traffic recorded • Card traffic range: 350 MB – 117 GB • Over the 11 weeks • 5% of cards account for 50% of overall traffic • Daily range: 53 MB – 240 GB
Users and Mobility • 18% of cards stayed within one building • Could change with PDAs • Card use range: once - every day • Mostly short sessions • Frequent associations (sync problems) • Overlapping cells cause cards to constantly roam • Less aggressive card firmware needed
Users and Mobility • 40% of roaming sessions crossed subnets • Card forced to obtain a new IP address
AP Activity • Busiest AP saw 71 cards • Busy APs located in lecture halls • Maximum and average daily traffic seen at APs with few cards • Residence halls • Traffic range: 39 MB – 2 GB per day
Protocols • 2.6% of frames sent to broadcast MAC • 99.7% of frames contained IP packets • Evenly split between inbound and outbound • 99% of traffic comprised of TCP and UDP • 2.5% of bytes – UDP • 97.5% of bytes – TCP • 9 application protocols accounted for 85.4% of all packets sniffed
Conclusions • Average behavior is not a good indicator of bursty behavior • Network use is concentrated • Wireless cards extremely aggressive when associating • Large number of short “sessions”
Conclusions • Extra-subnet roams occur even when the user is stationary • IP traffic failures • High activity variances throughout • Time and space • Traffic is not dominated by inbound or outbound • Most users stationary within a session