Download
1 / 16
160 likes | 320 Views
IB Business Management. UNIT: 5.3 – Break-even Analysis pg. 642 Understand/practice break-even analysis & margin of safety. Fixed or Variable? Direct or Indirect?. Rent Wages Salaries Materials Insurance Commission Utilities. Breaking Even.

E N D
IB Business Management UNIT: 5.3 – Break-even Analysis pg. 642 • Understand/practice break-even analysis & margin of safety
Fixed or Variable?Direct or Indirect? • Rent • Wages • Salaries • Materials • Insurance • Commission • Utilities
Breaking Even • Business can be in one of the following financial situations: • Loss: costs exceeds revenue • Break-Even: costs equal revenue • Profit: revenue exceeds costs
Breaking Even • Break-even point exists where a business makes neither profit nor loss • This occurs at the level of output where total costs equal total revenue • Typically a goal of new firms
Contribution • What is the purpose of calculating contribution? Unit contribution = P - AVC • Any product w/ a positive contribution will help pay some of the FC of the company • Contribution analysis gives 3 ways profits can be improved: • Increase sales revenue • Reduce VC • Reduce FC
Meaning of Break-Even Point • Total Costs = Total Revenue when output reaches the break-even point • Any sales above the break-even quantity will generate a profit • Sales below the break-even level will yield a loss
Break-even Analysis • A business can only survive in the long run if revenue > costs • New firms especially want to determine the level of sales needed to generate a profit
Break-Even Analysis • Two purposes for conducting a break-even analysis, which helps determine: • If its financially worthwhile to produce a particular good or service (such as introducing a new product) • Amount of profit that business is likely to earn if things go according to plan
Break-Even Analysis • Example • Jeans retailer has fixed costs of $2,500 per month • Each pair of jeans sells for $30 • $10 in variable costs per pair of jeans • What is the break-even point?
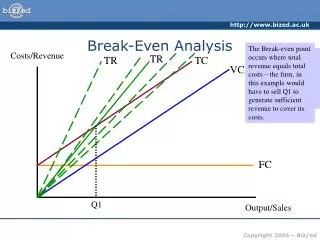
Calculating Break-Even Point • Method 1 • Identify where total costs equal total revenue on a break-even chart • The break-even point is the position where the total cost line intersects the total revenue line (TC=TR)
Calculating Break-Even Point • Method 2 • Using the TC = TR rule: • TFC + TVC = Price x Quantity • 2500 + 10(Q) = 30Q • 2500 = 20Q • 125 = Q (pairs of jeans)
Calculating Break-Even Point • Method 3 • Unit contribution is difference between a product’s price and variable cost • Contribution = Price – VC • Break-Even Point = TFC / Unit Contribution • $2500 • $30-10 • = 125 pairs
Break-Even Example • Use the unit contribution method to calculate the break-even quantity for a firm that has the following financials: • TFC = $200,000 • AVC = $5 • Price = $30 • P - AVC = unit contribution • Break-even = fixed costs • unit contribution
Margin of Safety • Measures difference between firm’s current sales quantity & break-even point • Positive margin means that firm is making a profit • Always shown in units, not dollars! • Safety margin = level of demand – breakeven qty.
Margin of Safety Example • Demand for jeans is 200 pairs per month • Break-even point is 125 pairs per month • Safety margin is 75 units (200-125 = 75) • This means the business can sell 75 fewer pairs of jeans before losing money.
Constructing a Break-even Chart • Rules to follow when constructing BE chart: • Draw/label TFC line • Draw/label TC line. Q = 0; TC start at ??? • Draw/label TR line. Q = 0; TR starts at ??? • X-axis is labeled as “Output” or units • Y-axis is labeled as “Costs, Revenues, Profit” $$$