Download
1 / 10
120 likes | 290 Views
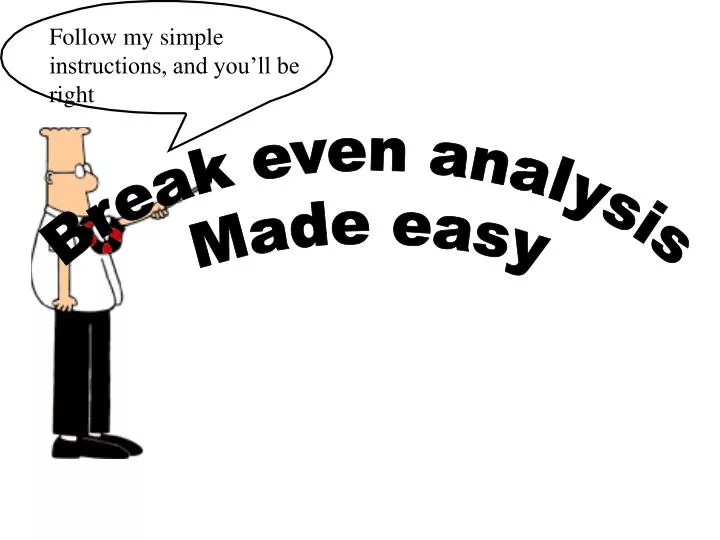
Follow my simple instructions, and you’ll be right. Break even analysis Made easy. Label the x axis output, and the y money. The fixed cost is always a horizontal line. Multiply your ‘handy’ number by the variable cost per unit, and plot that point.

E N D
Follow my simple instructions, and you’ll be right Break even analysis Made easy
Multiply your ‘handy’ number by the variable cost per unit, and plot that point.
Using your plotted point, join it up with the origin, and extend it if necessary
Draw a line parallel to the Variable cost line, that starts where the FC line does
Again, find a handy number, and this time multiply it by the price. Plot this point, and join it up with the origin
Where the revenue and total cost lines cross is the break even point. Break even point Break even quantity
Profit is the VERTICLE distance between the revenue and TC lines profit
Margin of safety is the difference between current output, and the break even point. Break even point Current output Margin of safety