Download
1 / 8
80 likes | 205 Views
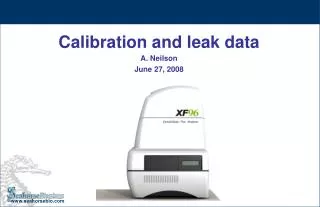
Calibration and leak data A. Neilson June 27, 2008. Curve data. Superimposed data sets from SH and Buck measurements over Curve Ksv (K=.0143), and Curve (9.16e19X^-4.44). Leak through wall. Leak around perimeter of probe. Leak data.

E N D
Calibration and leak data A. Neilson June 27, 2008
Curve data Superimposed data sets from SH and Buck measurements over Curve Ksv (K=.0143), and Curve (9.16e19X^-4.44)
Leak data Total leak is the theoretical leakage as a result of both perimeter leak and wall leak. Both are more significant than originally thought! %O2 id the dP across the boundary condition.
Leak back Leak rate 1mm/min Solubility (@ 6.79ul)= 9.6pmol/mm Back leakage = 10pmol/min @ dP=35mm (dP=20-5=15%) Based on theoretical leak it should be roughly 60pmol/min Difference between theoretical and actual is likely due to the complex geometry and actual path length to the sensor
2008-06-11 Ksv Why do these rates seem so slow? 10ugms should be 100pmol/min basal and 5-10X with FCCP, 1000pmol/min??