Download
1 / 11
110 likes | 206 Views
Building your 1st Performance Point Dashboard in Sharepoint 2010. Michael Mei, MCITP-BI, MCTS-BI mmei@brightlightconsulting.com BI/DW Consultant Brightlight Consulting. Contact Information. mmei@brightlightconsulting.com Twitter: @BI_MichaelMei bimichaelmei.wordpress.com. PPS Elements.

E N D
Building your 1st Performance Point Dashboard in Sharepoint 2010 Michael Mei, MCITP-BI, MCTS-BI mmei@brightlightconsulting.com BI/DW Consultant Brightlight Consulting
Contact Information • mmei@brightlightconsulting.com • Twitter: @BI_MichaelMei • bimichaelmei.wordpress.com
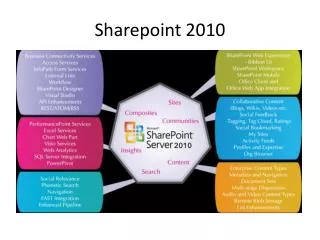
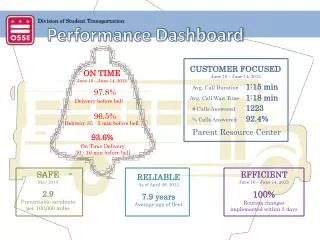
PPS Elements Data Source Key Performance Indicator (KPI) Indicator Scorecard Report Filter Dashboard
Dashboard Designer • Click-once deployed Windows application for developing PPS elements • All item definitions are saved in a Workspace file and in SharePoint lists • -The Workspace file has an extension of .ddwx • Includes a ribbon with three tabs: • -Home, Edit, and Create • Presents three panes: • -Workspace Browser • -Design pane – used for designing items • -Details pane – used to report dependencies or to provide resources for the design of Scorecard, Report, and Dashboard elements
Dashboard Element • Collection of pages that group related interactive scorecards and reports • Is the only item that is deployed to SharePoint • Dashboards are assembled from: • - Filters • - Scorecards • - Reports • Connections are defined between the assembled items to allow values to be sent and received
Dashboard Configuration • Dashboard pages consist of zones • Zones can be configured: • - Name • - Size • - Orientation • Filters, Scorecards, and Reports are added to the zones • Connections and display conditions are configured between the items • Each page, when deployed, will produce a Web Part page in SharePoint
Additional Resources • SQL Server 2008 R2 Update for Developers Training Kit • Business Intelligence Dashboards: Sales Solution • PerformancePoint Dashboard Designer videos • 2010 Information Worker Demonstration and Evaluation Virtual Machine • SharePoint 2010 on Windows 7, Windows Server 2008
Contact Information • mmei@brightlightconsulting.com • Twitter: @BI_MichaelMei • bimichaelmei.wordpress.com
About Me • BI/DW Consultant for Brightlight Consulting • MCITP-BI, MCTS-BI, MCSE, MCP+I, Project+ • 12+ year of IT Experience • Twitter: @BI_MichaelMei • Blog: bimichaelmei.wordpress.com