Download
1 / 29

E N D
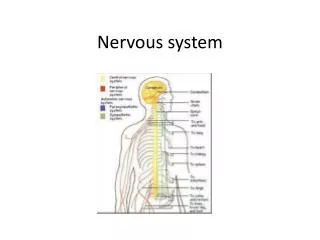
Nervous System [Note: This is the text version of this lecture file. To make the lecture notes downloadable over a slow connection (e.g. modem) the figures have been replaced with figure numbers as found in the textbook. See the full version with complete graphics if you have a faster connection.]
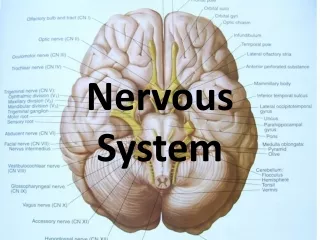
Organization of the nervous system [See Fig. 48.1]
Morphology of a neuron [See Fig. 48.2]
Types of neurons [See Fig. 48.3]
Example of a reflex pathway with the three types of neurons: knee-jerk (or patellar) reflex [See Fig. 48.4]
Glia • Glia are the “glue” of the nervous system that support and surround neurons. • Types: • radial glia: tracks for neurons to travel along during development • astrocytes: structural and metabolic support for neurons, communication between glia and neurons also likely. Astrocytes also aid in the generation of the • blood-brain barrier: capillaries in the CNS are tighter than in the rest of the body. Only small molecules usually pass into interstitial fluid called cerebrospinal fluid (CSF) • oligodendrocytes: form myelin sheaths in CNS • Schwann cells: form myelin sheaths in PNS [See Fig. 48.2]
Membrane Potential membrane potential of cells is usually negative (inside of cell more negative than outside) range is -50 to -90 mV. -70 mV = -70 X 10-3 V = -0.07 V membrane potential is due to permeability of membrane to potassium ions (K+) and maintained by an ionic pump called the Na-K ATPase (pumps three Na+ out for every two K+ it pumps back in) small leak of Na ions in raises membrane potential slightly the Nernst equation is used to calculate the equilibrium potential for an ion. EK = RT ln [K]oT = temp (oK), and [ion] o = out, i= in are only variables zF [K]i R = gas constant, F = Faraday’s constant, z = valence for conditions below EK = -85 mV Unstimulated potential of a cell is its resting potential [See Fig. 48.5]
hyperpolarization of membrane potential = more negative depolarization of membrane potential = more positive threshold = point at which voltage-gated Na+ channels open and trigger action potential (generally 15-20 mV above resting potential) the action potential is an all-or-none event (on or off, digital) [See Fig. 48.6]
[See Fig. 48.7] • a refractory period follows action potential because Na channels turn themselves off (inactivate) and take some time to recover. The nerve can’t be stimulated again until they recover. • the speed that the action potential travels (propagates) is determined by • a) the diameter of the axon: larger is faster • b) myelination: the action potential jumps from node to node, called saltatory conduction. Nodes are called nodes of Ranvier • most pain signals are carried by smaller axons than most sensory and motor signals • fastest conduction speed is ~150 m/sec = 336 mph
Synapses synapses are sites of communication between neurons and between neurons and their targets some neurons are connected directly through electrical synapses made from gap junction channels called connexons. most synapses are chemical synapses [See Fig. 7.30]
[See Fig. 48.10] Chemical synapse 1) AP reaches terminal 2) calcium channels let in Ca2+ 3) vesicles fuse 4) neurotransmitter released 5) binds to receptor 6) opens channels 7) changes postsynaptic membrane potential
How neurons integrate signals [See Fig. 48.11]
Temporal and spatial summation • EPSP = excitatory postsynaptic potential (depolarization) • postsynaptic channels are usually Na+-permeable channels • IPSP = inhibitory postsynaptic potential (usually hyperpolarization) • postsynaptic channels are usually K+ or Cl+-permeable channels [See Fig. 48.12]
Functional class Category Neurotransmitter Location Indolamine Brain stem - midline Generally inhibitory Serotonin (5-HT) raphe nuclei Catecholamines Dopamine Brain Stem Generally inhibitory Brain Stem Noradrenergic Neurons - Norepinephrine locus coeruleus Excitatory or inhibitory Brain Stem Adrenergic Excitatory or inhibitory Epinephrine Neurons Acetylcholine Neuro-muscular Excitatory at vert NMJ E or I elsewhere junctions, ANS, & CNS Amino Acids Aspartate Excitatory Glutamate Spinal cord Lower brain Nervous system, Glycine pancreas, & adrenal Inhibitory GABA gland Excitatory Peptides Substance P Pituitary, PNS Generally inhibitory Enkephalin
Organization of nervous systems many animals show cephalization: concentration of neurons and sensory organs in the head, nerve cord carries signals for rest of body [See Fig. 48.13]
Organization of the vertebrate nervous system [See Fig. 48.14]
Organization of the nervous systems white matter is primarily myelinated axons passing through area gray matter is primarily cell bodies and dendrites of neurons ganglia are collections of neurons outside the CNS nuclei are collections of neurons inside the CNS [See Fig. 48.4]
The ventricles are an “internal lake” in the brain, filled with CSF
Organization of the peripheral nervous systems (PNS) [See Fig. 48.15]
Parasympathetic division is responsible for regulating “rest and digest” functions Sympathetic division is responsible for regulating “fight or flight” functions [See Fig. 48.16]
Development of the divisions of the brain [See Fig. 48.17]
The suprachiasmatic nucleus (SCN) of the hypothalamus regulates daily biological rhythms [See Fig. 48.18]
Cerebrum processes most complex functions of brain divided into cerebral hemispheres corpus callosum connects the hemispheres cerebral cortex is gray matter 5 mm thick but approx. 80% of total brain mass basal ganglia (nuclei) coordinate motor input and output [See Fig. 48.19]
Motor and sensory cortices are mapped in relation to body topology and proportional in size to sensitivity of function [See Fig. 48.20]
Measuring the activity of the human brain An electroencephalogram (EEG) is a measurement of the electrical activity of the brain [See Fig. 48.21]
Mapping the structure of the human brain • CT scan (computed tomography): thin sections of tissue calculated from controlled X-rays • Can be used to detect tumors and other abnormalities of brain structure [See p. 987]
Mapping the activity of the human brain • PET scan (positron emission tomography): metabolic or chemical activity of the brain can be followed with time. • Radioactive glucose or oxygen commonly used. • More active brain regions use more oxygen and glucose so they give off a larger signal than the rest of the brain. • Used to map areas of brain responsible for different functions (e.g. language, learning, vision) [See p. 987]
Mapping the activity of the human brain MRI (magnetic resonance imaging): uses nuclear magnetic resonance (NMR) effect to detect differences in water content of the brain fast scanners can make maps of the brain in action, like a PET scan, called functional MRI (fMRI) Active brain regions give off a larger signal than the rest of the brain [See p. 987]
The limbic system and frontal lobes regulate emotions Learning and memory is coordinated by the hippocampus and amygdala lobotomy (severing connection between frontal lobes and limbic system) was once used to reduce emotional activity [See Fig. 48.23]