Download
1 / 25
270 likes | 480 Views
NSF Grant DRL-1316782. Measuring Sea Level Change. by: Ping Wang Denise Davis. What is sea level?. Or should we say what is mean sea level?. Mean Sea Level. Before we answer the question “What is mean sea level?” Let’s take a closer look at how the sea level changes.

E N D
NSF Grant DRL-1316782 Measuring Sea Level Change by: Ping Wang Denise Davis
What is sea level? Or should we say what is mean sea level?
Mean Sea Level Before we answer the question “What is mean sea level?” Let’s take a closer look at how the sea level changes.
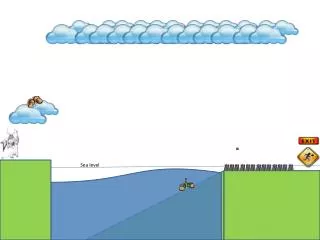
Sea Level Variations: Daily changes or tides • Sea level rises and falls every 12 hours at most places or every 24 hours at some locations • This is called ocean tides.
Sea Level Variations: Seasonal changes • Sea level also varies seasonally • e.g., in Tampa Bay the water level tends to be higher in the summer and lower in the winter
Sea Level Variations: Multi-year changes • Sea level also varies in terms of years • e.g., during El Nino years, the sea level along the US Pacific coast tends to be higher than during La Nina years
Sea Level Variations: Irregular changes Sea level also varies irregularly. • During a storm the sea level can rise very fast to a level that is much higher than normal level, this is called storm surge. Storm surge animation (click here) http://www.nhc.noaa.gov/surge/animations/hurricane_stormsurge.swf
Sea Level Variations: Irregular changes Sea level also varies irregularly. • During a Tsunami the sea level can rise and fall EXTREMELY fast in a few minutes.
Then when we say global sea-level rise, what do we really mean? We mean: the mean sea level, many times the mean sea level of a large region, or even the entire earth. Then how do we “get” the mean sea level? Before we can get the “mean sea level”, how do we get “just” the sea level? Like many other earth phenomena, we measure sea level. It turns out the measuring sea level is not very difficult and we have been measuring sea level for several hundreds of years.
Let’s take a look at the History and Technology of measuring sea level Back in the old days, we measure sea level with a stilling well, (just like we measured the water table on land, in a well….) As the water level rises and falls, the float rises and falls. The mechanical device (at the top) “draws” the sea level on a roll of paper The stilling well is designed to “filter” out the wave motion (with the small holes near the bottom)
Let’s take a look at the History and Technology of measuring sea level Today, we measure sea level with much more sophisticated equipment than the stilling well, but the principal remains similar. The water level is not measured with a float any more, instead it is measured with sound (called acoustic sensor), much like an echo sounder on a boat. The drum recorder is replaced by a digital computer.
Let’s take a closer look at a modern water level measurement station Acoustic sensor to measure water level Housing to keep the computer and equipment out of the weather Sensor to measure wind speed and direction Solar panel to supply power Satellite antenna to send the data to the internet Computer to process and store data Stilling well to “filter” out wave motion
The previous slides illustrate how we measure water level at the coast, then how do we measure water level in the vast ocean? It turns out that we could not measure water level in the deep ocean until about 20 years ago, when we began to have satellites that can accurately measure elevation.
Measuring Sea Level: Using satellite This is called satellite altimetry. It is quite complicated and we will not going into details here.
What causes sea level change? An introduction: we will get into much details of these in the chemistry, physics, and geology units. Here are some examples (regardless of time scales): • Tides • The attractions from the Sun and the Moon • Thermal expansion • Water expands when becomes warmer • Note that the average ocean depth is 4000 m, a slight expansion may result in a “significant” rise of the sea. For example, a 0.03% (a tiny bit) expansion results in a sea level rise of 1.2 m (or 4 ft). • Continental ice melting • Will add water to the ocean • Strong wind associated with storms • Will “pile” water up along the shoreline, call storm surge • Plate tectonics • Will change the size of the ocean basin
What causes sea level change? Global warming, which scientists have pretty solid theory and data to support, will result in the following: • Thermal expansion • Water expands when becomes warmer • Note that the average ocean depth is 4000 m, a slight expansion may result in a “significant” rise of the sea. For example, a 0.03% (a tiny bit) expansion results in a sea level rise of 1.2 m (or 4 ft). • Continental ice melting • Will add water to the ocean
In this History and Technology unit, you will be challenged (with a computer game) to build a water level gauge, just like the ones NOAA use.
Examples of what your tide gauge can and should do:Example 1: SuperstormSandy The Battery is where Wall Street and part of the subway system in NY is located. The water level here recorded to about 14 ft. during Superstorm Sandy. This water level is several feet higher than the entrances to the subway resulting in the flooding of the subway. The Battery, NY Notice that the Sandy Hook water level measurements stop on Oct. 29th. Once the water level reached 13 ft. the gauge broke. The water level surpassed the maximum limit of the gauge measurement capability. Sandy Hook, NJ
Examples of what your tide gauge can and should do:Example 1: Superstorm Sandy The roller coaster on the beach is “under water” due to the rising of the sea.
Examples of what your tide gauge can and should do:Example 2: Long term sea level trend
Examples of what your tide gauge can and should do:Example 3: Long term sea level trend Compared to Example 2 (2.24 mm/yr), why is the sea level rising much faster here (9.24 mm/yr)? We will answer this question in the geology unit.
Examples of what your tide gauge can and should do:Example 4: Long term sea level trend Why is the sea level falling here (-9.80 mm/yr)? We will answer this question in the geology unit.
The questions in the previous slides are complicated. We do not have the knowledge in this unit yet to answer them. We will answer them in the geology unit, after we lean more about sea-level in the chemistry and physics units.
Your (game) goal for this unit: to design a gauge that can measure surge by, e.g., Superstorm Sandy and long-term trend. This is not an easy task. Will your goal be achieved?
Your can get LOTS of information from:http://tidesonline.noaa.gov/