Download
1 / 7
70 likes | 163 Views
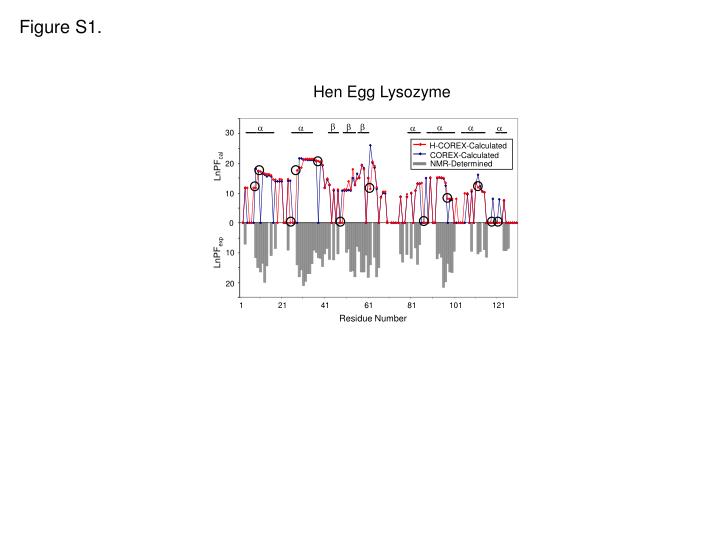
. . . . . . . . . 30. H-COREX-Calculated. COREX-Calculated. 20. NMR-Determined. LnPF cal. 10. 0. LnPF exp. 10. 20. 1. 21. 41. 61. 81. 101. 121. Residue Number. Figure S1. Hen Egg Lysozyme. . . . . . . . . . . . . . 18. 12. LnPF cal.

E N D
30 H-COREX-Calculated COREX-Calculated 20 NMR-Determined LnPFcal 10 0 LnPFexp 10 20 1 21 41 61 81 101 121 Residue Number Figure S1. Hen Egg Lysozyme
18 12 LnPFcal 6 0 6 LnPFexp 12 18 1 21 41 61 81 101 121 Residue Number H-COREX-Calculated COREX-Calculated NMR-Determined Figure S2. Equine lysozyme
20 y = 0.91x - 0.23 2 R = 0.75 15 10 deuteron incorporation per peptide DXCOREX-calculated 5 0 0 5 10 15 20 Experimentally-determined deuteron incorporation per peptide Figure S3. Catalytic subunit of PKA E230Q
8 y = 1.06x + 0.15 2 R = 0.82 6 4 deuteron incorporation per peptide DXCOREX-calculated 2 0 0 2 4 6 8 Experimentally-determined deuteron incorporation per peptide Figure S4. -actinin CH2 domain
20 y = 0.73x + 0.45 2 R = 0.80 15 deuteron incorporation per peptide DXCOREX-calculated 10 5 0 0 5 10 15 20 Experimentally-determined deuteron incorporation per peptide Figure S5. Rosiglitazone-bound PPAR LBD
Figure S6. pH = 6.1 pH = 8.8 (A) (B)
Table S1. Study Proteins