Download
1 / 6
60 likes | 154 Views
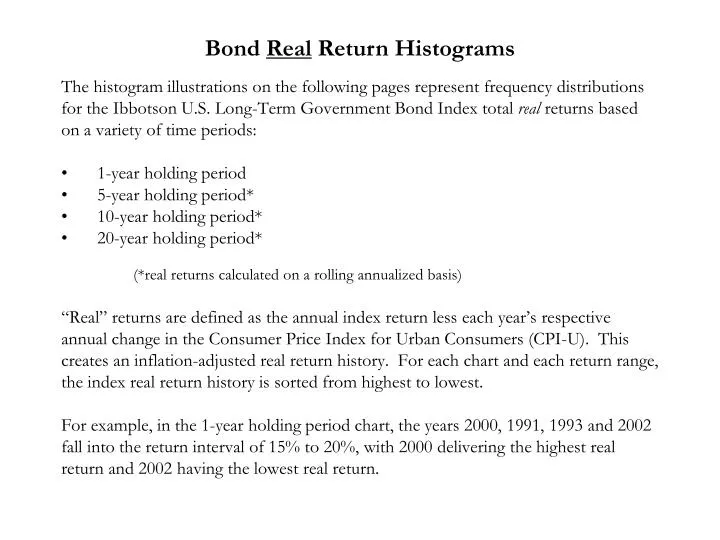
Bond Real Return Histograms. The histogram illustrations on the following pages represent frequency distributions for the Ibbotson U.S. Long-Term Government Bond Index total real returns based on a variety of time periods: 1-year holding period 5-year holding period*

E N D
Bond Real Return Histograms The histogram illustrations on the following pages represent frequency distributions for the Ibbotson U.S. Long-Term Government Bond Index total real returns based on a variety of time periods: • 1-year holding period • 5-year holding period* • 10-year holding period* • 20-year holding period* (*real returns calculated on a rolling annualized basis) “Real” returns are defined as the annual index return less each year’s respective annual change in the Consumer Price Index for Urban Consumers (CPI-U). This creates an inflation-adjusted real return history. For each chart and each return range, the index real return history is sorted from highest to lowest. For example, in the 1-year holding period chart, the years 2000, 1991, 1993 and 2002 fall into the return interval of 15% to 20%, with 2000 delivering the highest real return and 2002 having the lowest real return.
U.S. LT Government Bonds Annualized Rolling 5-Year Real Return Histogram
U.S. LT Government Bonds Annualized Rolling 10-Year Real Return Histogram
U.S. LT Government Bonds Annualized Rolling 20-Year Real Return Histogram
Disclosures Performance represents the total return of the Ibbotson U.S. Long-Term Government Bond Index over a variety of time periods. The Ibbotson U.S. Long-Term Government Bond Index is an unweighted index which measures the performance of twenty-year maturity U.S. Treasury Bonds. Each year a one-bond portfolio containing the bond having closest to 20 years to maturity is constructed. To measure holding period returns for the one-bond portfolio, it is prices (with accrued coupons) over the holding period and total returns are calculated, including investment of income. Index returns include dividend and/or interest income and do not reflect the removal of fees or expenses. Index performance is provided as a benchmark but is not illustrative of any particular investment. An investment cannot be made in an index and market indexes do not include expenses. The performance data shown represents past performance, which is not a guarantee of future results. Investment returns and principal value will fluctuate, so that investors' shares, when sold, may be worth more or less than their original cost. The Consumer Price Indexes (CPI) measure changes in the prices paid by urban consumers for a representative basket of goods and services. Sources: Ibbotson, Bureau of Labor Statistics, FPS calculations