Download
1 / 28
320 likes | 631 Views
Equipment Productivity. By T.A. Khan January 2008. Overall Equipment Effectiveness. In an ideal factory, equipment would operate 100 percent of the time at 100 percent capacity, with an output of 100 percent good quality. In real life, however, this situation is rare.

E N D
Equipment Productivity By T.A. Khan January 2008
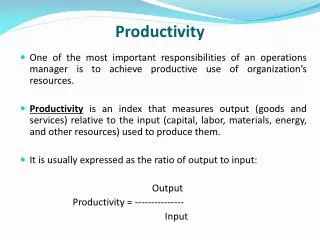
Overall Equipment Effectiveness In an ideal factory, equipment would operate 100 percent of the time at 100 percent capacity, with an output of 100 percent good quality. In real life, however, this situation is rare. The difference between the ideal and the actual situation is due to losses. Calculating the overall equipment effectiveness (OEE) rate is a crucial element of any serious commitment to reduce equipment- and process-related wastes through total productive maintenance (TPM) and other lean manufacturing methods like Operational Excellence, Six Sigma or World Class Manufacturing.
Schedule Losses • Losses Due to Planning • Forecasting • Initial Capacity Planning • Production Planning • Execution • Skills • Machine Condition • Material Quality
Principles of Forecasting Forecasts are rarely perfect Forecast accuracy is: higher for shorter time horizons Grouped forecasts are more accurate than individual items
1. Decide what to forecast: Level of detail, units of analysis & time horizon required 2.Evaluate & analyze appropriate data Identify needed data & whether it’s available 3. Select & test the forecasting model Cost, ease of use & accuracy 4. Generate the forecast 5. Monitor forecast accuracy over time Step-by-Step
Qualitative methods: Forecasts generated subjectively by the forecaster Quantitative methods: Forecasts generated through mathematical modeling Types of Forecasting Methods
Future Past • Strengths: • Incorporates inside information • Particularly useful when the future is expected to be very different than the past • Weaknesses: • Forecaster bias can reduce the accuracy of the forecast Qualitative Methods
Strengths: • Consistent and objective • Can consider a lot of data at once • Weaknesses: • Necessary data isn’t always available • Forecast quality is dependent upon data quality Quantitative Methods
Types of Quantitative Methods • Time Series Models: • Assumes the future will follow same patterns as the past • Causal Models: • Explores cause-and-effect relationships • Uses leading indicators to predict the future
Capacity Planning • Initial Capacity Planning • How Much Do we need? (Volume) • When do we need? (Time horizon) • Where to make? (Location) • Capacity Expansion • Lead Strategy • Lag Strategy • Average
Initial Capacity Planning • Capacity decisions are important because: • 1. They have an impact on the ability of an organisation to meet future demands. • 2. There is a definite relation between capacity & operating costs. • 3. Initial investments depends upon capacity decisions. • 4. It involves long term commitment of resources.
Capacity Planning What kind of capacity is needed? (Intended product or services) How Much is needed? (The agony of too much & too little CAPACITY.) Three Basic Question When it is needed? (Opportunity missed is opportunity lost)
Capacity Expansion • Volume & certainty of anticipated demand • Strategic objectives for growth • Costs of expansion & operation • Incremental or one-step expansion
Capacity lead strategy Capacity lag strategy Units Units Capacity Demand Capacity Demand Time Time Average capacity strategy Incremental vs. one-step expansion Units Units Capacity One-step expansion Incremental expansion Demand Demand Time Time Capacity Expansion Strategies
Strategies for Meeting Non-Uniform Demand • Build up inventory • Back-ordering • Smooth demand through marketing • increase price to reduce demand • decrease price to increase demand
Strategies for Meeting Non-Uniform Demand • Vary capacity • overtime • extra shifts • subcontracting • hiring and layoffs
OEE (TPM) • Implementing TPM means striving toward a vision of the ideal manufacturing situation, a vision that encompasses • zero breakdowns • zero abnormalities • zero defects • zero accidents • The path to this ideal situation is a process of continuous improvement that requires the total commitment of everyone in the company, from operators to top management.
OEE (TPM) Total productive maintenance (TPM) was first defined in 1971 by the Japan Institute of Plant Maintenance (JIPM). TPM is a company wide strategy to increase the effectiveness of production environments The difference between the ideal and the actual situation, in factory operations, is due to losses. Equipment operators face the results of these losses on a daily basis. TPM gives them the tools to identify the losses and make improvements. A key strategy in TPM is identifying and reducing what we call the six big losses.
Business Objectives & Strategy Production Objectives & Strategy • Plant & Equipment • Asset register • Classification • Criticality • Operating Regimes Maintenance Policy Maintenance Objectives • Maintenance Strategy • Preventive • Corrective • Information • Management • Technical • Manuals • Drawings • Analysis • Resources • Parts/ Tools • Services • Facilities • Equipment • Diagnostics • Procedures • Planning • Scheduling • Technical • Organisation • Accountability • Communication • Structure • Support • Partners • Control system • Measurement • Reports • Tracking • Action People Trade skills, Engineering Skills, Management Skills, Safety, Training & development, Leadership People Values, Rewards, Recognition, Sanctions Maintenance Management A formalised Framework, accepted by senior mngt.,, within which decisions on maintenance are taken. The organisation of maintenance activities within an agreed policy
Set-up Availability losses Breakdown Minor Stoppages Performance losses Speed losses Start-up losses Quality losses In process losses Overall Equipment Effectiveness(OEE) Inconsistent Times, Insufficient skills. Poor Planning & scheduling, Different methods, Poor tooling, Poor start up controls Missing parts, Insufficient support, Excess start-up adjustment Lack of maintenance, Low operator interest, not knowing of problems, Poor Training, Design Problems, Inferior Material Material not available, Change over at start/end Jams/misfeeds/ overloads, operator error, operator absence Overall Equipment Effectiveness Unclear design specs., poor maintenance history, incorrect settings, Poor Training, Speed deliberately reduced, inconsistent Material Poor machine changeover, Inconsistent materials, No start-up check lists, Waiting for temp. - pressures, Minor adjustments Temperature & pressure changes, inconsistent materials, Process not followed, poor calibration, Gauges not calibrated properly.
We recommend that the operator collect the daily data about the equipment for use in the OEE calculation. Collecting this data will • teach the operator about the equipment • focus the operator’s attention on the losses • grow a feeling of ownership of the equipment • The shift leader or line manager is often the one who will receive the daily operating data from the operator and process it to develop information about the OEE. Working hands on with the data will; • give the leader/manager basic facts and figures on the equipment • help the leader/manager give appropriate feedback to the operators and others involved in equipment improvement • allow the leader to keep management informed about equipment status and improvement results