Download
1 / 91
1.58k likes | 3.54k Views
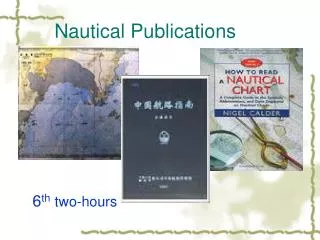
Session 1 Nautical Charts. Even though you have taken a navigation course before…. …you will probably learn some new tricks today that will make your boating a little easier and safer. Objectives.

E N D
Even though you have taken a navigation course before… …you will probably learn some new tricks today that will make your boating a little easier and safer.
Objectives • To become familiar with data found on Nautical Chart and how it relates to GPS and the (P)ATON Program. • To understand chart orientation. • To be introduced to the compass rose and understand variation error. • To become familiar with the data found in the General Information Block on a nautical chart.
To understand how depths are depicted on a nautical chart. • To become familiar with the symbols and abbreviations found on a nautical chart. • To understand the scale of a nautical chart. • To be introduced to the horizontal and vertical datum on a nautical chart and their effect on GPS sets and accuracy.
To be introduced to the symbols that represent Aids to Navigation on a nautical chart. • To learn to read bottom characteristics on a nautical chart. • To help you understand the critical relationships between your GPS set and a nautical chart.
Why you need to use a Nautical Chart with GPS. • The Nautical Chart is the road map for the sea. “An accident at sea… …can ruin a good day.”
Knowing how to read a nautical chart helps you: • Identify any hazards and dangers along your course line. • Effectively plot a course on your chart.
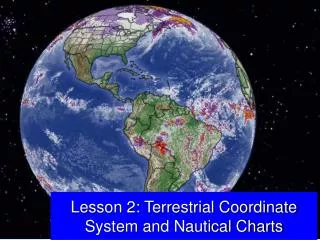
The Mercator Projection. • Converts the earth’s sphere onto a flat surface usable as a chart. • Projects the earth’s sphere onto a cylinder. • True North is usually at the top of the Mercator projection. • The distance between Meridians of Longitude becomes distorted as you move away from the equator toward the Poles.
The Earth as a Sphere. • True Geographical North is found at the top of the chart. This is the axis on which the earth spins. • Circumference of the earth is 21,614 nautical miles. [ Divide by 360 degrees to get 60 nm per degree.] • Magnetic Northis016 degrees Westof Geographical north in the Boston area.
THE EARTH as a GLOBE
EASTERLY VARIATION EASTERLY VARIATION EASTERLY AND WESTERLYVARIATION EASTERLY VARIATION GEOGRAPHIC NORTH POLE MAGNETIC NORTH POLE WESTERLY VARIATION ANGULAR DIFFERENCE BETWEEN TRUE NORTH AND MAGNETIC NORTH WESTERLY VARIATION
Isogonic Lines 21 E variation 10 W variation 10o E variation 0 variation
Parallels of Latitude Meridians of Longitude THE GLOBE
LATITUDE LATITUDE LINES ARE PARALLEL AND RUN IN TRUE EAST AND TRUE WEST DIRECTIONS 75 90 NORTH POLE 60 LATITUDE IS MEASURED IN DEGREES NORTHERN HEMISPHERE IS NORTH OF THE EQUATOR 45 30 30 DEGREES NORTH LATITUDE 15 15 DEGREES NORTH LATITUDE 0 EQUATOR 15 DEGREES SOUTH LATITUDE 15 30 DEGREES SOUTH LATITUDE SOUTHERN HEMISPHERE IS SOUTH OF THE EQUATOR 30 45 60 ANIMATION 75 SOUTH POLE 90
One Minute of Latitude equals One Nautical Mile
LONGITUDE LONGITUDE LINES ARE NOT PARALLEL GEOGRAPHIC NORTH POLE LINES OF LONGITUDE ARE CALLED MERIDIANS GEOGRAPHIC SOUTH POLE
Prime Meridian 000
On a Mercator Chart, Rhumb Lines cross Meridians of Longitude at the same angle.
RHUMB LINE Creating a LOXODROME 55 55 55
Great Circlesare the shortest distance between two points. • GPSsets always project Great Circle bearings. • All Meridians of Longitude are Great Circles. • All Parallels of Latitude are Small Circles except the Equator. • The intersection of Meridians and Parallels define a position on the earth’s surface that is called aFIX.
Lambert Conformal Projection. • Projects the sphere of the earth on a cone. • Charts of the Great Lakes are Conformal Projections. • Aeronautical charts are Conformal Projections. • Conformal projections are more accurate in the northern latitudes.
POLYCONIC PROJECTION LINES OF LONGITUDE ARE NOT PARALLEL, BUT CLOSE TO BEING PARALLEL DISTORTION IS MINIMIZED A SPHERICAL SURFACE PROJECTED ON A SERIES OF TANGENTIAL CONES A
SMALL SCALE CHART EVERYTHING APPEARS SMALL – less detail. 1:100,000 MEANS 1 INCH ON THE CHART IS 100,000 INCHES ON THE EARTH’S SURFACE. LARGE SCALE CHART EVERYTHING APPEARS LARGE – more details. 1:1,000 MEANS 1 INCH ON THE CHART IS 1,000 INCHES ON THE EARTH’S SURFACE.
A Large Scale Charts provides a smaller area and more details.
San Diego Approach Small Scale 1:100,000
1:80,000 Small Scale 1:25,000 Large Scale
Coastal Chart 1:40,000 1:150,000
Coastal Chart 1:40,000 1:150,000
Harbor Chart 1:2,000 1:40,000
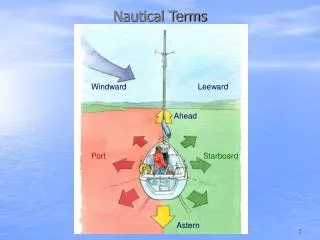
Chart Orientation • TRUE NORTH is at the top of the chart. • EASTis at the right-hand side of the chart. • WEST is at the left-hand side of the chart. • SOUTH is at the bottom of the chart.
New Terminology • Meridians of Longitude • Vertical lines on the chart. • Numbered in degrees eastward and westward from the Prime Meridian located in Greenwich, England. • Longitude Scales are found at the top and bottom of a nautical chart. • Distortion occurs as the Meridians approach the poles. • Always Great Circles.
Parallels of Latitude[ LAT is FLAT] • The horizontal lines on a Nautical Chart. • Numbered in degrees north and south of the equator toward the poles. • Latitude scales are located at the left and right hand sides of the nautical chart. • One degree of latitude is equal to 60 nm. • One minute of Latitude is equal to one nm. • Latitude scales are used to measure distance on a nautical chart.
SC - Small Craft Chart • The Small Craft Chart is the exception to the rule. • True North orientation is not at the top of this chart. • Use the Compass Rose to orient True North on a SC Chart.
The Compass Rose • Every chart has a least one Compass Rose. • The star on the Compass Rose points to True North. • The outer circle projects True North, • The inner circle projects Magnetic North.
Magnetic North is 016 degrees to the West in the Boston area. • The difference between True and Magnetic North is called Variation Error. • Variation Erroris printed in the center of the Compass Rose. • By using the latest charts, you will always have the latest up-to-date variation references. • Many newer GPS sets automatically adjust for Variation Error. Check your GPS manual!
Chart Number • Located at the bottom left-hand corner of a nautical chart. • Chart Number is the official document number for the chart. • Edition Number is also shown. • Date of last Update indicates the last time that the chart was updated was 10:00 AM on this date.
The Coast Guard publishes data for correcting nautical charts in a free publication called the:LNM - Local Notice to Mariners. • The LNM Internet Address is:www.navcen.uscg.mil • Always use the latest edition charts for the greatest safety.