Download
1 / 31
310 likes | 415 Views
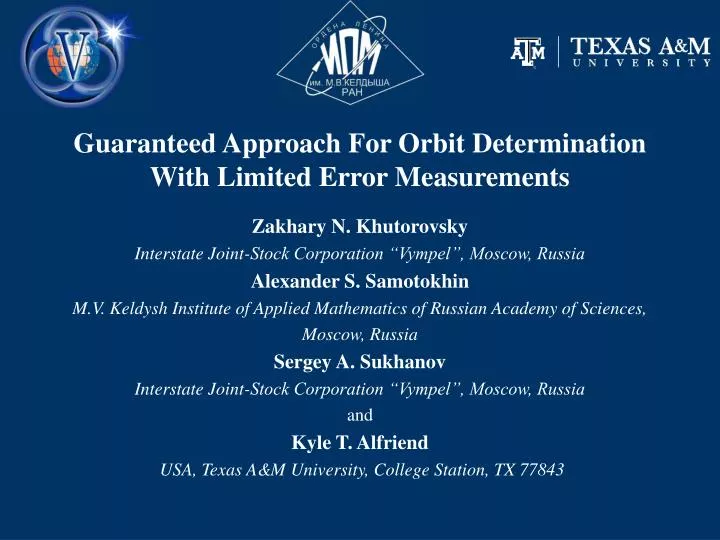
Guaranteed Approach For Orbit Determination With Limited Error Measurements. Zakhary N. Khutorovsky Interstate Joint-Stock Corporation “Vympel”, Moscow, Russia Alexander S. Samotokhin M.V. Keldysh Institute of Applied Mathematics of Russian Academy of Sciences, Moscow, Russia

E N D
Guaranteed Approach For Orbit DeterminationWith Limited Error Measurements Zakhary N. Khutorovsky Interstate Joint-Stock Corporation “Vympel”, Moscow, Russia Alexander S. Samotokhin M.V. Keldysh Institute of Applied Mathematics of Russian Academy of Sciences, Moscow, Russia Sergey A. Sukhanov Interstate Joint-Stock Corporation “Vympel”, Moscow, Russia and Kyle T. Alfriend USA, Texas A&M University, College Station, TX 77843
THE PREVENTING POTENTIAL COLLISIONS BETWEEN ARTIFICAL SPACE OBJECTS (SO) IS MAIN PURPOSE Two types of the errors are possible: the miss of collision (probability α) and a false alarm (probability β). The errors α and β depend on: 1. the accuracy of a the method used for determination of SO predicted position. 2. correspondence level of actual object predicted position errors to their calculated values. IS IT POSSIBLE TO REDUCE THE FREQUENCY OF THE MISS OF COLLISION AND THE FREQUENCY OF THE FALSE ALARM ESSENTIALLY USING ALREADY AVAILABLE MEASURING INFORMATION?
FEATURES OF EXISTING ALGORITHMS • 1. The statistical approach is applied. • 2. The algorithms are based on a method of the least squares and its recurrent modifications. • The algorithms have the property of a global optimality for Gaussian distribution of measurement errors and the property of an optimality in a class of linear algorithms for any error distributions. • The errors of real measurements are non-Gaussian. The nonlinear algorithms may exist too. Therefore the existing algorithms does not provide the minimal errors of SO predicted positions generally. • The algorithms does not provide the computation of correlation matrixes of object predicted position errors, which correspond to actual values of these errors.
IS IT POSSIBLE TO CREATE THE ALGORITHMS, WHICH CALCULATE SPACE OBJECT PREDICTED POSITIONS USING THE MEASUREMENTS AND WHICH HAVE THE FEATURES LISTED BELOW? 1. CORRESPONDENCE TO THE PROPERTIES OF REAL ERRORS (the distribution is not known, the non-abnormal values are limited by known constants) IS BETTER, THAN IN THE EXISTING ALGORITHMS. 2. CALCULATED VALUES OF THE ERRORS CORRESPOND TO THEIR REAL VALUES. 3. ACTUAL ERRORS OF SPACE OBJECT PREDICTED POSITION DEFINITIONARE NOT GREATER, THAN THE ERRORS OF THE LEAST SQUARES METHOD ? 1. YES 2. YES 3. sometimes YES
STATEMENT OF THE PROBLEM Let y = (y1, y2, … yn) are the measurements of some functions I(x) = (i1(x), i2(x), … in(x)), where xis of m-dimensional vector of parameters. Let t 1≤ t2 ≤…≤ tnare times of measurements. Let = (1, 2, …n) are measurement errors limited by the known constants above, i.e.. y = I(x) + δ |δk| ≤ εk = 1,2,…,n Let target function is z = S(x). In our problem xare orbit parameters and zis position vector in a certain time t. It is required to find an estimation zga = zga(y) of parameter zwith the least errors zga - z and to estimate maximal values of these errors max |zga - z|. LINEARIZATION LS estimation: xLS= arg minx(y - I(x))′∙W∙(y - I(x)),W– weight matrix of measurements. Linearised problem: y = I∙x + δz = S∙x |δk| ≤ k=1,2,…,n y := y - I(xLS) x := x - xLS z := z - zLS I = ∂I/∂x(xLS) S = ∂S/∂x(xLS)
Not statistical approach 1. In 1960-1970 in mathematics the theory of optimum algorithms in the normalized spaces has been developed. It was applied to the decision of mathematical problems of approximation in the theory of functions, the differential both integrated equations and other abstract mathematical disciplines. 2. In 1980th years this theory has been adapted to the decision of estimating and predicting problems at the only thing of assumptions of measurement errors - limitation by known values. Since 1970-1980 years this approach has found practical application in applied areas: power, electronics, chemistry, biology, medicine, etc. 3. In space information-analytical systems the USA and Russia the given approach was not applied. The possible reasons are complexity, uncertainty in its efficiency, unwillingness to reconstruct already created systems radically. THE WORK IS DEVOTED TO THE DEVELOPMENT AND THE RESEARCH OF NEW METHODS BASED ON THIS APPROACH FOR ORBITS DETERMINATION.
STATEMENT OF THE PROBLEM FOR NON-STATISTICAL APPROACH R={r} ─ the linear normalized space Norm n(r) = ║r║ ─is a functions on R , which satisfies to the conditions: ─ nonnegative n(r) ≥ 0 (if n(r) = 0, then r = 0) ─ linearly-scalable n(r) = ||n(r) ─ convex n(r1+r2) ≤ n(r1) + n(r2). Example of norm: lp= (∑k|rk|p)1/p, rk–k-th component of vector r. ─ p = 2 regular vector magnitude l2 = (∑k|rk|2)1/2, ─ p = 1 the sum of modules of vector components l1 = ∑k|rk| ─ p = ∞ the maximum modulus of component l∞ = maxkrk. X ─ unknown element space (m-dimensional) Y ─ known measurement space (n-dimensional, n ≥ m. ) Z ─ solution space (p-dimensional). In our applied problem the elements of space X are orbit parameters, Y are the measurements of known functions of these parameters, Zare position coordinates in a certain time. The condition of limitation of measurement errors |δk| ≤ εk = 1,2,…,n is equivalent to a condition ║δ║≤ ε, where l∞ is understood as norm.
S: X → Z solution operator S(x). I:X → Y information operator I(x) (mapping I(x) is to be one-to-one). The measurement y Yis known. It is necessary to find a solution element z Z. If y = I(x) (measurement is correct), then x =I-1(y) and z =S(x) The problem is solved. Usually y ≠ I(x) and y - I(x) = (measurement error) ║║ ≤ ε (ε ─ known constant). A: Y → Zalgorithm (gives the approximation of solution element z by the y measurement. Ux(y) = {xX║I(x) - y║ ≤ ε} ─ the uncertainty area x for the measurement y Uy(x) = {yY║I(x) - y║ ≤ ε} ─ the uncertainty area y for unknown element x Uz(y) = S{Ux(y)}─the uncertainty area z for the measurement y
X ─ unknown element space (m-dimensional) Y ─ known measurement space (n-dimensional, n ≥ m. ) Z ─ solution space (p-dimensional).
THE EXAMPLES OF THE ALGORITHMS 1. Correct algorithmAcr.Acr(I(x)) = S(x) for each xUx(y) It is similar to the concept of unbiased parameter estimate in statistical approach. 2.Interpolated algorithmAin.Ain(y) Uz(y) for each yUy(x) D = max(z1,z2Ux(y)) ║z1 - z2║ ─ the diameter of uncertainty area Uz(y) is the guaranteed ranges of any interpolated estimate parameters for any realization of measurement errors. It is serves as a one-dimensional analog of Fisher information matrix in statistical approach. The interpolated algorithm has property of adaptation to real measurement errors. The more frequent error values close to the maximum possible value and having different signs are in particular realizations of measurements, the less is such algorithm error. 3.Central algorithmAсn Aсn(y) = arg minz (maxvUz(y)║z - v║) Aсn(y) ─ Chebyshev center of uncertainty area Uz(y), i.e. a point of set Z , for which the maximum distance to points Uz(y) is minimal. 4.Projected algorithmAprApr(y) = S(xpr) xpr = arg min║y – I(x)║= minε Ux(y,ε) Apris the projection of Y space yn-vector to m-dimensional subspace I(X). Apris a limit of uncertainty area Ux(y) = Ux(y,ε), when it is subtended to the point by decreasing of upper limit of errors . Projective estimation xpr is interpolated and robust (it is independent from ).
ONE DIMENTIONAL CASE (m=1) yk = x + δk |δk| ≤ (k=1,2,…,n) z =xUx(y) = {x R1ymax - ε≤x ≤ymin+ ε} xga =Acn(y) =Apr(y) = (ymax+ymin)/2 D = 2ε - ymax +ymin |xga- x| ≤ ε - (ymax - ymin)/2
estimation formula error measurements distribution RMS estimation errors for different distribution errors number of measurements n uniform triangular gaussian 10 20 30 50 100 xНК= (Σyi)/n σ/sqrt(n) σ/sqrt(n) σ/sqrt(n) uniform 0.62 0.45 0.38 0.27 0.24 xГП = (ymax+ ymin)/2 ≈ 2.5•σ/n ≈ 1.1•σ/sqrt(n) ≈ 1.3•σ/log(n) triangular 1.10 1.09 1.07 1.03 1.05 gaussian-3σ 1.20 1.53 1.70 2.10 2.84 The comparison of RMS estimation errors LS and GA (asymptotic) The ratio of mean errors of GA and LS estimations (simulation–1000)
THE ALGORITHM ERRORS AND OPTIMALITY e(A, x, y) = ║A(y) – S(x)║ ─ the error of algorithm A ex(A) = maxyUy e(A, x, y) ─ the error of algorithm А for the worst measurement errors ey(A) = maxxUx e(A, x, y) ─ the error of algorithm А for the worst xUx (y) optimal algorithm Aopt,y ex(Aopt,y) = minA ex(A) ─ the algorithm minimizes the error ex(A) for each of A and x optimal algorithm Aopt,x ey(Aopt,x) = minA ey(A) ─ the algorithm minimizes the error ey(A) for each of A and y The central algorithm is Aopt,x algorithm. optimal algorithm Aopt e(Aopt) = minA ex(A) = minA ey(A) ─ the algorithm is optimal for each of the two tipes
THE ALGORITHMS IN NORM l∞ AND THEIR OPTIMALITY The problem is linear: I(x) = I·xS(x) = S·x I, S ─ matrixes n×m and p×m. 1.Асn = Aopt ─ the central algorithm is optimal. zcn = Асn(y) = 0.5∙(zM +zm) z (zcn-zmax, zcn+zmax) zmax = 0.5∙(zM - zm) zk,m=minxUx (s′k∙x) zk,M=maxxUx (s′k∙x) - ≤ yq-i′q∙x ≤ k=1,2,…,pq=1,2,…,n zk,m, zk,M ─ components p-vectors zm, zM s′k, i′q ─ k-th иq-th rows of matrixes S, I It is equivalent to 2p linear programming problems in m-dimentional space X. 2. The projective algorithm Аpr is interpolated and it is not optimal. The projective estimation xpr is a solution of linear programming problem: min αxUx,α -α∙ ≤ yq-i′q∙x ≤ α∙Ux,α= {xX: ║I∙x - y║ ≤ α∙ε} q=1,2,…,n in (m+1)-dimentional space (X,). xpr loses in error ey to the optimal estimation xcn not more than two times. THE CENTRAL AND PROJECTIVE ALGORITHMS ARE NONLINEAR
THE ALGORITHMS IN NORM l2AND THEIR OPTIMALITY The problem is linear: I(x) = I·xS(y) = S·y I, S ─ matrixes n×m and p×n. Асn = Аpr = Aopt ─ central, projective and optimal algorithms are the same. An estimate of the solution parameters is the estimate of LS zcn= zpr = zLS = S·(I′·I)-1·I′·y. The estimate zLS is linear function of measurements y. The estimation zLS is neither optimal nor interpolated in norm l∞ . THE ALGORITHMS IN NORM l1AND THEIR OPTIMALITY The problem is linear: I(x) = I·xS(y) = S·y I, S ─ matrixes n×m and p×n. Optimal and central algorithms are unknown. Projective estimation xpris a solution of the least modules (LM) problem xpr= arg minx(║I∙x- y║= ∑q|yq- i′q∙x |) q=1,2,…,n which can be reduced to linear programming problem. The estimation xpr is interpolated and it is not central.
n parameter x1 parameter x2 uniform distrib. gaussian-3σ distrib. uniform distrib. gaussian-3σ distr. δx1,cn /δx1,LS δx1,cn /δx1,LS δx1,cn /δx1,LS δx1,cn /δx1,LS δx1,cn /δx1,LS δx1,cn/δx1,LS δx1,cn /δx1,LS δx1,cn /δx1,LS 10 0.74 0.80 1.20 1.39 0.83 0.84 1.32 1.34 20 0.50 0.64 1.41 1.69 0.64 0.67 1.31 1.47 30 0.52 0.56 1.55 1.85 0.53 0.57 1.42 1.69 50 0.39 0.43 1.86 2.31 0.44 0.48 1.51 1.88 100 0.30 0.34 2.43 2.99 0.33 0.38 1.69 2.37 TWO DIMENTIONAL CASE (m=2) yq=x1+(q-n/2)∙x2+δq |δq|≤ q=0,1,…,n z = x Ux(y)=∩q{yq-ε≤x1+(q-n/2)∙x2≤yq+ε} central estimation xk,m= minxUx xk zk,M= maxxUx xk yq-ε ≤ x1+(q-n/2)∙x2≤yq+εk=1,2 q=0,1,…,n projective estimation min α yq-α∙ε ≤ x1+(q-n/2)∙x2 ≤ yq+α∙ε in space (x1, x2, ) q=0,1,…,n 0<α≤1 The ratio of mean errors of GA and LS estimations (simulation –1000)
Realizations of LS and central estimations for model m=2 (distribution of error measurements: Gauss truncated of level 3σ, n=100)
Realizations of LS and central estimations for model m=2 (distribution of error measurements: triangle, n=100)
Realizations of LS and central estimations for model m=2 (distribution of error measurements: uniform, n=100)
The comparison of algorithms used two different approaches (real situation, simulation) SCENARIO: ·1-1 ─ one passage of SO through one radar coverage zone ·1-N ─ all passages of SO through one radar coverage zone during 10 days ·3-N ─ all passages of SO through three radars coverage zone during 10 days. INITIAL DATA: ·coordinates of radar stand points: 1: =0.7, =0 2: =1.0, =0.6 3: =0.75, =-0.6h=0. ·radar coverage zone:5°≤≤60°, – elevation angle. ·measurement times: 1-1: each 5 sec from SO entry into radar coverage zone up to exit, 1-N,3-N: each 5sec during 50sec ·measured parameters: the spherical coordinates d, , – range, azimuth, elevation angle.
·measurements errors: the distribution of uncorrelated errors: uniform, triangular, Gaussian truncated at the level of three "sigmas"; root-mean square value of errors d=0.15 km, =0.003 radians, =0.003 radians; systematic distance error is equal to half the maximum value of the uncorrelated error with arbitrary sign. ·motion model: Earth - EGM-96 igg=75, Moon, Sun, atmospheric perturbations, solar radiation pressure. ·orbit parameters: 6-vector of Lagrange elements in the moment tn. ·solution parameters: the coordinates of position vector propagated to nd= 0,1,3,5,7,10 days in the first orbital coordinate system (r, t, n). ·ratio of area to SO mass: is a constant and equal to 0.01 m2/kg. ·SO trajectories: eccent. e0, inclin. i57°, altitudes above ground h800 km и 1500 km. ·number of measurements:n = 65-155, 550, 1750 in 1-1, 1-N, 3-N. ·number of realization in simulation:nr=100. COMPARATING INDEX OF ALGORITHMS:δξ=(∑i|ξi-ξ|)/nr- mean error
1 radar, 1 passage, uncorrelated errors δξ(XLS) [m,m/s]and δξ(XCN)/δξ(XLS) for various measurement error distributions
LS [m] uniform triangular gaussian-3σ nd r t n r t n r t n r t n 0 34 54 21 0.17 0.10 0.22 1.0 0.5 1.0 2.1 1.0 2.0 1 34 54 24 0.17 0.13 0.22 1.0 0.7 1.0 2.1 1.3 2.0 3 34 39 29 0.17 0.21 0.22 1.0 1.0 1.0 2.1 2.2 2.0 5 34 35 34 0.17 0.29 0.22 1.0 1.2 1.0 2.1 2.4 1.9 7 35 44 40 0.17 0.25 0.22 1.0 1.1 1.0 2.1 2.2 1.8 10 35 73 47 0.02 0.19 0.22 1.0 0.9 1.0 2.1 1.3 1.8 1 radar, all passages during 10 days, uncorrelated errors δξ(ZLS)[m]and δξ(ZCN)/δξ(ZLS) for various measurement error distributions
LS [m] uniform triangular gaussian-3σ nd r t n r t n r t n r t n 0 31 27 6 0.02 0.05 0.10 0.2 0.4 1.0 0.4 1.1 2.6 1 31 20 6 0.02 0.07 0.11 0.2 0.6 1.0 0.4 1.7 2.2 3 32 15 7 0.02 0.13 0.11 0.2 1.1 1.0 0.4 2.5 2.1 5 32 23 8 0.02 0.10 0.11 0.2 1.0 1.0 0.4 2.1 2.1 7 32 36 9 0.02 0.08 0.11 0.2 0.8 1.0 0.4 1.6 2.1 10 32 59 11 0.02 0.06 0.11 0.2 0.6 1.0 0.4 1.2 2.2 3 radars, all passages during 10 days, uncorrelated errors δξ(ZLS) [m] and δξ(ZCN)/δξ(ZLS)for various measurement error distributions
LS [m] uniform triangular gaussian-3σ nd r t n r t n r t n r t n 0 35-39 100-170 8-13 0.06 0.10 0.24 0.4 0.5 1.2 0.8 0.6 2.0 1 35-39 100-175 12-20 0.06 0.10 0.24 0.4 0.5 0.9 0.8 0.6 1.2 3 35-39 100-175 21-36 0.06 0.10 0.24 0.4 0.5 0.6 0.8 0.6 0.8 5 36-40 100-180 31-54 0.06 0.11 0.10 0.4 0.5 0.5 0.8 0.6 0.7 7 37-40 105-180 41-71 0.06 0.12 0.09 0.4 0.5 0.5 0.8 0.6 0.7 10 38-41 110-185 55-99 0.06 0.13 0.08 0.4 0.5 0.5 0.8 0.7 0.6 3 radars, all passages during 10 days, uncorrelated and systematic errors δξ(ZLS)[m] and δξ(ZCN)/δξ(ZLS) for various measurement error distributions
LS [m] uniform triangular gaussian-3σ nd r t n r t n r t n r t n 0 31 27 6 0.6 1.3 3.0 2.4 0.9 3.2 3.7 4.6 18 1 31 20 6 0.6 2.2 3.1 2.4 1.8 3.2 3.7 12 17 3 32 15 7 0.6 2.1 3.0 2.4 1.5 3.0 3.7 9.4 16 5 32 23 8 0.6 1.0 2.8 2.4 0.8 3.2 3.7 5.1 17 7 32 36 9 0.6 0.7 2.9 2.4 0.5 3.6 3.7 3.7 18 10 32 59 11 0.6 0.5 2.7 2.4 0.3 3.6 3.7 3.1 16 3 radars, all passages during 10 days, uncorrelated errors,ε̃ = 2εδξ(ZLS) [М]and δξ(ZCN)/δξ(ZLS) for various measurement error distributions
LS estimation central estimation (CN) coordinates r t n r t n model igg 8 16 32 8 16 32 8 16 32 8 16 32 8 16 32 8 16 32 nd = 0 3.5 0.9 1.0 1.0 2.0 0.9 1.1 1.0 1.0 17 6.0 4.2 14 6.8 6.0 22 5.6 2.4 nd = 1 3.7 0.9 1.0 5.0 1.2 0.9 1.2 1.0 1.0 18 6.0 4.2 45 6.0 5.8 32 4.2 2.6 nd = 3 2.9 0.9 1.0 9.2 2.2 1.1 1.2 1.0 1.0 15 8.8 4.2 48 22 5.0 26 3.3 2.5 nd = 5 4.1 1.2 1.0 5.6 1.3 1.0 1.8 1.1 1.0 22 13 4.2 32 5.8 4.5 29 6.1 2.5 nd = 7 5.7 1.2 1.0 8.0 1.2 1.0 3.0 1.0 1.0 23 13 4.2 23 4.4 3.8 35 5.4 2.7 nd = 10 5.0 1.3 1.0 4.1 3.0 0.9 3.9 1.0 1.0 25 15 3.8 13 23 3.5 39 4.0 2.9 1 radar, all passages during 10 days, uncorrelated errors with uniform distrib. δξ(ZLS,igg)/δξ(ZLS,igg=75) and δξ(ZCN,igg)/δξ(ZCN,igg=75)withigg = 8, 16, 32
THE CONCLUSIONS 1. The non-statistical approach corresponds to properties of real measurements errors. 2. The non-statistical approach provides the computation of the solution parameters errors corresponding to their real values. 3. The interpolated algorithms of the non-statistical approach have property of adaptation to real measurements errors. 4. The estimation of solution parameters in interpolated algorithms turns out the more precisely and advantage in accuracy in comparison with method LS the more, than the big part of errors is concentrated in near-border area. 5. The problem is more informative, the central algorithm in relation to LS better works. 6. The correlations in measurement errors worsens quality of solution parameters estimation in central algorithm less, than for method LS. 7. The projected algorithm is not critical to accuracy of knowledge of errors upper limit. The central algorithm has not such feature. The projected algorithm can lose in accuracy to the central algorithm no more than in 2 times. 8. The central and projected algorithms are more critical to methodical errors of SO movement model, than the LS method. WHEN AND HOW TO APPLY ALGORITHMS OF NON-STATISTICAL APPROACH IN PRACTICE? THE ANSWER TO THIS QUESTION DEPENDS ON ERROR CHARACTERISTICS OF REAL MEASURING TOOLS
рс = kехр(- 0.5 krr) k = Sv(42kvvdet K1det K2det (К1-1+К2-1))-0,5 (1) S= (dl+d2)2/4 krr = r(К1+ K2)-1r' kvv = v(К1+ K2) -1v' tmin– the time when two objects approach the minimum distance; r,v–vectors of the relative position and velocity intmin; К1, К2– covariance matrices of the errors of determination of the positions of both objects for the time tmin; d1, d2–dimensions of the objects. рс ≈ kехр(- A) k = (d1+d2)2/(σu∙(11σusin2α+16σwcos2α)) (2) A = (δu)2/(4σu2)+ (δv)2/(2σv2)+ (δw)2/(2σw2cos2α+2σv2sin2α) u, v, w– the projections of r in the directions u, v, w of the orbital coordinate system of an object in a near-circular orbit; – angle between the object velocity vectors v1 и v2 at time tmin;u (u1,u2), v€(v1,v2), w (w1,w2) It follows from (1) and (2) that if a collision occurs in this dangerous approach ·if the errors in the determination of the approaching SO positions decrease, then pc increases. For example, if the errors decrease by an order of magnitude, pc increases by two orders of magnitude; ·overestimation or underestimation of the calculated errors result in a significant decrease in pc. For example, if the calculated errors are increased by an order of magnitude, pc decreases by two orders of magnitude and it tends to zero if errors are decreased by an order of magnitude.