Download
1 / 16
160 likes | 294 Views
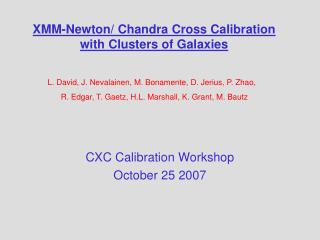
XMM-Newton/ Chandra Cross Calibration with Clusters of Galaxies. CXC Calibration Workshop October 25 2007. L. David, J. Nevalainen, M. Bonamente, D. Jerius, P. Zhao, R. Edgar, T. Gaetz, H.L. Marshall, K. Grant, M. Bautz.

E N D
XMM-Newton/ Chandra Cross Calibration with Clusters of Galaxies CXC Calibration Workshop October 25 2007 L. David, J. Nevalainen, M. Bonamente, D. Jerius, P. Zhao, R. Edgar, T. Gaetz, H.L. Marshall, K. Grant, M. Bautz
Plot from the IACHEC Meeting in May comparing MOS, PN, and ACIS spectral fitting results in the 2-7 keV band for a sample of 7 clusters.
Comparison of ACIS derived temperatures in a broad band, a hard band and from the H-like to He-like Fe K alpha line ratio.
Sensitivity of Fe line ratio to gas temperature Abell 2029 – 7 temperature simulated spectrum fit to a single temperature model
Residuals in the Abell 2029 spectrum assuming the gas temperature is given by the Fe line ratio (kT=7.9 keV).
Two corrections have been applied to the predictions of the raytrace code since XRCF. Empirical XRCF correction HRMA overlayer of 22A
Sensitivity of derived cluster temperatures on the depth of the HRMA overlayer with the empirical XRCF correction.
Spectra fitting results with a HRMA effective area model with the XRCF empirical correction and a depth of 15A for the overlayer.
Sensitivity of derived cluster temperatures on the depth of the HRMA overlayer without the empirical XRCF correction.
Spectra fitting results with a HRMA effective area model without the XRCF empirical correction and a depth of 10A for the overlayer.
Spectra fitting results with a HRMA effective area model without the XRCF empirical correction and a depth of 10A for the overlayer. Comparison with XMM-Newton AGN Gratings data
Two corrections have been applied to the predictions of the raytrace code since XRCF. Empirical XRCF correction HRMA overlayer of 22A
The SSD continuum measurement at XRCF vs. predictions from the XRCF version of the raytrace code with different depths for the overlayer.
Things to do Generate raytrace models for the XRCF version of the HRMA with a range of depths for the overlayer on each shell. Compare the raytrace predictions with the SSD continuum measurements for each shell. Determine the depth of the overlayer required to match the SSD continuum measurement for each shell. Apply the XRCF derived overlayer depths for each shell and the empirical XRCF corrections to the in-flight HRMA effective area model. Validate the in-flight HRMA effective area model with gratings and cluster data.