Download
1 / 9
100 likes | 246 Views
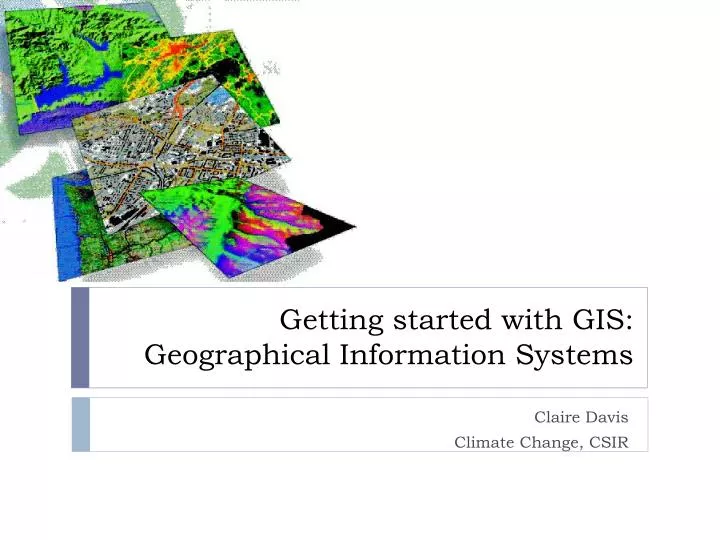
Getting started with GIS: Geographical Information Systems. Claire Davis Climate Change, CSIR. What is GIS?. GIS is a technological field that incorporates geographical features with tabular data in order to map and analyze assess real-world problems Two major ways of representing data:

E N D
Getting started with GIS: Geographical Information Systems Claire Davis Climate Change, CSIR
What is GIS? • GIS is a technological field that incorporates geographical features with tabular data in order to map and analyze assess real-world problems • Two major ways of representing data: • Raster • Vector
What makes GIS unique? Climate Change Downscalings • Spatial analysis: • Database Query • Overlay • Proximity Analysis • Network Analysis • Digital Terrain Model • Statistical and Tabular Analysis • Recently used in assessment of global change
The advantages of climate change data in GIS format • Kruger to Canyons Case Study • Biosphere Reserve in 2001 • UNESCO’s Man and Biosphere Programme Excellent subject for considering how climate change impacts might be successfully managed in a diverse landscape. Large climatic and topographical range Diverse array of land-use and economic activities Multiple different stressors across a range of scales
K2C Case Study • Aim: investigate and communicate the latest climate change predictions, impacts and research to key stakeholders within the diverse landscape of the Kruger to Canyons Biosphere Region • Stakeholder engagement = key component • Climate Change Handbook • www.rvatlas.org/k2c
Disadvantages and ‘to do’ list • GIS accuracy depends upon the source data • Inter-conversions between ArcGIS 9.1, ArcGIS 9.2, Edrisi Kilamanjaro/Taiga, and various freeware options • Finding the best way to communicate climate change information to a range of stakeholders
Tutorial and exercise • Been provided with: • GIS Manual (with background information on GIS) • K2C Handbook • Provinces of South Africa • Towns of South Africa • Kruger National Park • Rainfall and temperature projections from 2 models • Hawths Tools • 3 free GIS programs • Use this time to work through the tutorials (no/limited GIS background) and exercise (advanced)