Download
1 / 38
390 likes | 404 Views
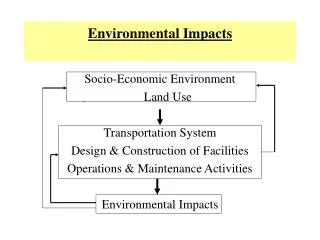
Evaluation of Environmental and Economic Impacts. Environmental Impacts. Baseline emissions inventory Emissions reductions Cost effectiveness Other environmental impacts. Inventory Development. Carbon dioxide and methane

E N D
Evaluation of Environmental and Economic Impacts
Environmental Impacts • Baseline emissions inventory • Emissions reductions • Cost effectiveness • Other environmental impacts
Inventory Development • Carbon dioxide and methane • Used EMFAC2002 mobile source emissions model (version 2.2, April 2003) • Emission rates in EMFAC derived from extensive in-use vehicle testing • Vehicle activity • Population from DMV registration • Miles traveled from local Transportation Planning Agencies
Inventory Development • Nitrous oxide (N2O) • Collected N2O and NOx emissions data for ~ 120 vehicles • Developed correlation between NOx and N2O emission rates • Used correlation equations to derive N2O emission factors from NOx rates in EMFAC
Inventory Development • HFC-134a • Emissions by mass balance • Lifetime emissions = initial charge + recharges - amount recovered at end • Number of recharges: 12,000 vehicles in 9 fleets; surveys of 966 vehicle owners • End-of-life recovery: survey of dismantlers, discussions with USEPA & California reclaimers
Inventory Development • HFC-134a • Over 16 year lifetime, average HFC-134a vehicle emits ~80 grams per year • Includes leakage, accidental and end-of life releases, and servicing fugitives • Does not include emissions from: • “do-it-yourself” repairs • topping Freon systems with HFC-134a
Climate Change Inventory CO2 equivalent baseline inventory without impact of regulation
Climate Change Inventory CO2 equivalent inventory without impact of regulation
Impact on Emissions Trends -25% -17%
Cost Effectiveness • Technology improvements reduce operating costs more than they increase vehicle costs • Annualized costs based on NESCAFF and other sources; assumes average vehicle life of 16 years
Other Environmental Impacts • Positive impacts on: • fuel cycle emissions • energy cost and demand • other environmental media • Other considerations • effect on consumer behavior including vehicle use and purchase
Fuel Cycle CO2 Equivalent Emission Reductions(tons per day) 2030 2020
Analysis of Potential Economic Impacts Statewide Impacts Community Impacts Consumer Response
Scope of Analysis • Potential Impacts on: • Business Expansion or Elimination • Employment • Total Output • Personal Income • E-DRAM Model of California Economy
Impacts on California Economy • Annualized Costs • Annual Operating Cost Savings
Year Impact on Baseline With Reg. Change* Percent 2020 Output (billions in $2003) $3,078 $3,075 ($2.6) (0.08) Income (billions in $2003) $2009 $2,015 $5.4 0.30 Jobs(1000s) 18,661 18,718 57 0.30 2030 Output (billions in $2003) $4,242 $4,237 ($4.7) (0.10) Income (billions in $2003)) $2,781 2,789 $7.7 0.30 Jobs(1000s) 21,763 21,839 76 0.4 Economic Impacts on California * - Change in output/income presented to the nearest $100 million
State and Local Governments • 420,000 Government Vehicles • Average 12,500 Miles/Year • Costs and Savings Similar to Consumers • Net Positive Impacts
Summary of Potential Impacts • Net Positive Impacts on: • Costs and Savings • Employment • Personal Income • Business Expansion • State and Local Governments
Community Impacts • Low-income communities and communities of color may be particularly vulnerable to climate change • Working with outside sources to study the impacts of climate change on these communities
Community Input • ARB has been working with stakeholders to get input from communities throughout the process • Input at the community level is essential to a successful partnership and regulation
Low-Income Impact • Annualized costs are from $13 to $33 • Annual reduction in operating costs are from ~$100-150
Impacts on Affiliated Businesses • Used San Diego as example • Net increase in jobs and businesses • Reduction in future growth of gasoline station jobs and businesses • More than offset by increased growth of jobs and businesses in other sectors
CARBITS Model • Consumer Choice Model • Developed By UC Davis • Household Vehicle Purchase • 14 Vehicle Classes • Inputs of Vehicle Attributes • Outputs of Sales and Fleet Size • Regulation Compared to Baseline
Baseline Scenario • Vehicle Prices Increase Slightly • Operating Costs Decline Slightly • Fuel Price - $1.74/gallon • Acceleration Increases Slightly • All Other Attributes Remain the Same
Regulatory Scenario • Vehicle Prices Increase by Vehicle Class/Model Year • Operating Costs Decline by Vehicle Class/Model Year • All Other Attributes Remain the Same
Consumer ResponseResults Aging of the Fleet 10.40 10.20 10.00 9.80 Average age (years) 9.60 9.40 9.20 9.00 2009 2010 2011 2012 2013 2014 2015 2016 2017 2018 2019 2020 Baseline scenario Regulation scenario
Consumer ResponseFleet Turnover Effect • Based on CARBITS Results • Pollutants Considered • ROG • NOx • PM10 • Emission Impacts < 0.1% in 2020
Consumer ResponseVehicle Miles Traveled Impact • Rebound Effect Definition • UC Irvine Study • California-Specific Estimates • Rebound number for 2020 • Similar Results with Travel Demand Models
Consumer ResponseVehicle Miles Traveled Impact • Rebound Effect of 1.27% • Pollutants Considered • ROG • NOx • PM10 • CO • Emission Impacts < 0.3% in 2020
Summary of Economic Analysis • Net Positive Statewide Impacts • Net Positive Community Impacts • Consumer Response Produces Consistent Results