Download
1 / 17
170 likes | 284 Views
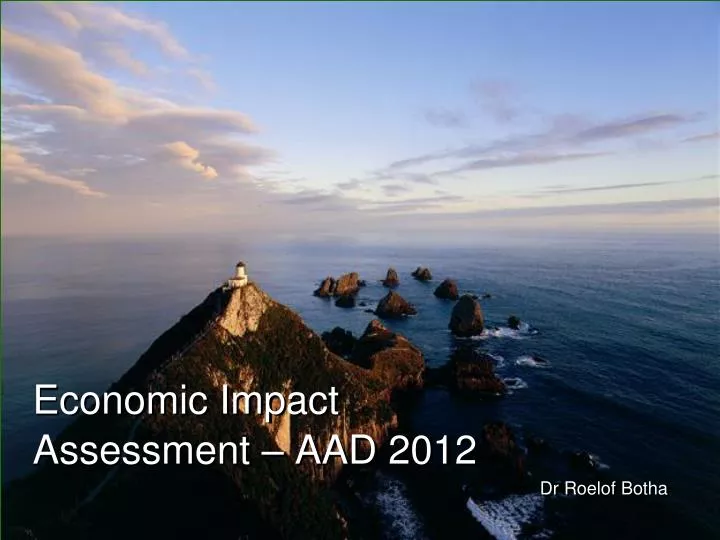
Economic Impact Assessment – AAD 2012. Dr Roelof Botha . Contents of EIA Study. Introduction Objectives of the Study Methodology Concise notes on the role of aviation The extended supply chain of aviation Demand & economic output effects of AAD 2012

E N D
Economic Impact Assessment – AAD 2012 Dr Roelof Botha
Contents of EIA Study • Introduction • Objectives of the Study • Methodology • Concise notes on the role of aviation • The extended supply chain of aviation • Demand & economic output effects of AAD 2012 • Employment creation flowing from AAD 2012 • Tax revenues generated by AAD 2012 • Ancillary economic impact effects • Summary of economic impact of AAD 2012
Fig 1: Average estimated total expenditure per trip to South Africa by foreign visitors to AAD 2012 R’000
Fig 2: Regional composition of estimated total expenditure by international visitors to AAD 2012 (Rm) Total R112.7m
Fig 3: Composition of international visitor expenditure by key category (% of total)
Fig 4: Regional composition of non-Gauteng trade visitors to AAD 2012 No.
Fig 5: Composition of key expenditure categories related to the hosting of AAD 2012 (R’000) Total R17.6 m
Figure 6: Economic output effects generated by the cost of exhibition stands & chalets R m
Fig 7: Employment creation by skills level emanating from all AAD 2012 expenditure categories Number of jobs
Fig 8: Employment created by AAD 2012 in terms of key economic sectors Jobs
Figure 9: taxation revenues generated by key expenditure categories at AAD 2012 R m
Fig 10: Number of international visitors to AAD 2012 – top-10 source countries (outside Africa) Number
Fig 11: Number of international visitors to AAD 2012 from Africa – top-10 source countries Number
Fig 12: Summary of economic output generated by AAD 2012 (Total R685 million) R million
Fig 13: Summary of employment created by AAD 2012 (Total 2,055 jobs) Number
Fig 14: Summary of taxation revenues generated by AAD 2012 (Total R 55.2 million) R million