Download
1 / 18
180 likes | 297 Views
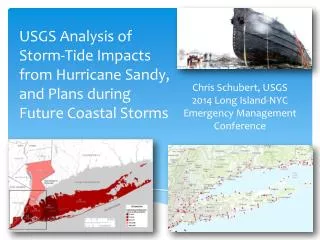
Storm Tide and Flooding from Hurricane Sandy In New York City. Xing Zheng Water Resources GIS Dr. David Maidment. Background.

E N D
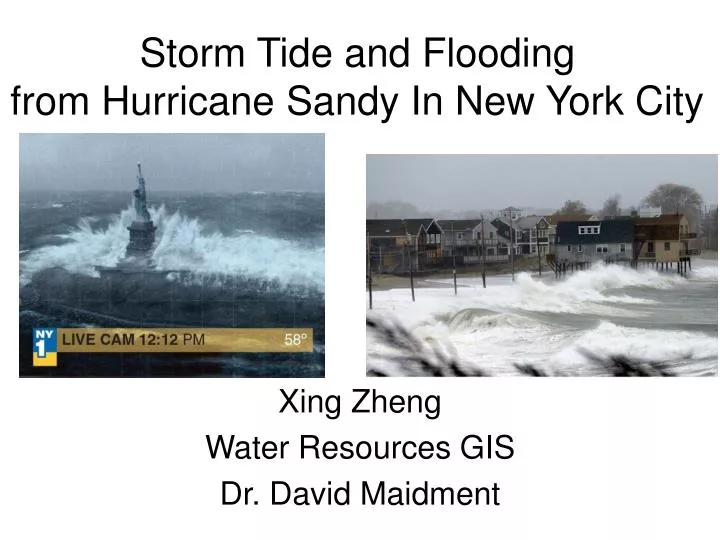
Storm Tide and Flooding from Hurricane Sandy In New York City Xing Zheng Water Resources GIS Dr. David Maidment
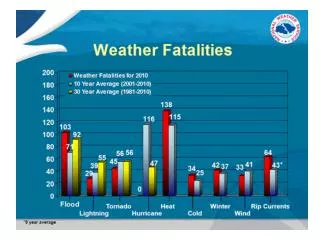
Background • Hurricane Sandy was the deadliest and most destructive hurricane of the 2012 Atlantic hurricane season, as well as the second-costliest hurricane in United States history. -- Wikipedia • Its storm surge hit New York City on October 29, flooding streets, tunnels and subway lines and cutting power in and around the city. Damage in the United States amounted to $65 billion (2013 USD).
Objective • Depending on the water-level monitoring network, we can determine the storm surge height at various gage points. • Combining these heights with the DEM of NYC, we can decide which part of the city was flooded at different moments. It can tell us how far inland such a storm surge would penetrate.
Data Source • Water-Level Data USGS Streamgage Observational Fixed-place Networks USGS Tidal Stations Monitoring Network NOAA Tidal Stations Water-Level Senors Temporarily Deployed Sensors Wave-Height Senors Real-time Rapid Deployment Gages
Data Source a hydrograph displaying water elevation data recorded at a site during Sandy A Water-Level(Storm-Tide) Sensor
Data Source • DEM--1/3 Arc Second(10m×10m) DEM for NYC
Result Distribution of Different type sites in New York City
Result • Table of Sites Information and Water Levels at 12 A.M., Oct. 28th, 2012
Result Water-Level at Different Sites (Point Values) A Sea Surface for The Whole Area (Area Value) Interpolation Natural Neighbor Interpolation Kriging Interpolation http://dilbert.engr.ucdavis.edu/~suku/nem/nem_intro/node3.html http://www.nbb.cornell.edu/neurobio/land/OldStudentProjects/cs490-94to95/clang/kriging.html
Result • Sea Surface from Natural Neighbor Method 12 A.M. Oct 28th, 2012
Result • Sea Surface from Natural Neighbor Method 12 A.M. Oct 29th, 2012
Result • Sea Surface from Kriging Method 12 A.M. Oct 29th, 2012
Result • Recall our experience in Ex 4, we did a raster calculation named "fill"-"dem", and found the Peter Sink. • Similarly, set the condition as "dem"-"sea surface "<0, and do the raster calculation. Then we can know which part of the city was flooded at different moment!
Result • Flood Map from Kriging Method 12 A.M. Oct 29th, 2012
Result 12 A.M. Oct. 28 12 A.M. Oct. 29 12 A.M. Oct. 30
Problem • Transformation (Coordinate System,Time Zone,Unit,…)--Call for Uniform Standards • Tediously Repetitive Work--Call for Programming to create more tools • Big Data--Long time to load. How to keep the balance between the Resolution and the Processing Efficiency
Future Work (if time available…) • Consider the effect of inland flood caused by precipitation • Use higher resolution DEM gotten from LIDAR Dataset • Try other interpolation methods and find the optimal solution • Do similar work for more timely events such as Typhoon Haiyan in Philippines • Try some programming work
The End Special thanks to the instruction of Dr. Maidment and Carlos Galdeano!