Download
1 / 18
180 likes | 199 Views
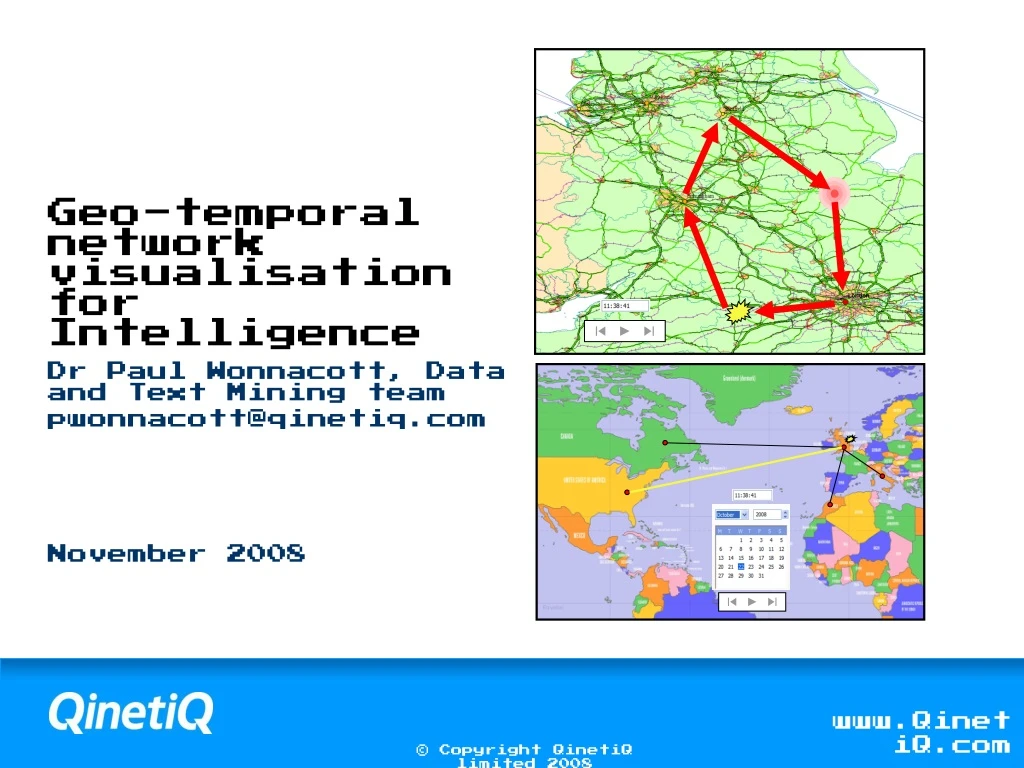
Geo-temporal network visualisation for Intelligence. Dr Paul Wonnacott, Data and Text Mining team pwonnacott@qinetiq.com. Overview. Need for techniques/tools to support the visualisation of intelligence-related networks that are geospatial in nature, but can vary over time

E N D
Geo-temporal network visualisation for Intelligence Dr Paul Wonnacott, Data and Text Mining team pwonnacott@qinetiq.com
Overview • Need for techniques/tools to support the visualisation of intelligence-related networks that are geospatial in nature, but can vary over time • Tools must be intuitive, easy to use & deliver real immediate benefits • Analysts suffer greatly from information overload • Will use mock-ups based on simplistic network visualisations from previous projects to motivate the need • Communication • Tracking • Will suggest a ‘radio player’ type, animated approach (potentially in 3D) to represent non-geospatial data
Communication • Attempting to visualise communication between an individuals & their contacts distributed around the globe • Original visualisation was a static I2 chart • Want to be able to visualise communication events in the individuals social network over time, together with significant geo-temporal events (e.g., a meeting) • May also want to visualise non-geospatial data, e.g., affiliation • Might be suited to 3D visualisation? • Spatial & abstract layers
Tracking • Attempting to visualise networks representing ‘the movement of things’ & significant geo-temporal events • Original visualisation was a static ArcGIS map • Visualisation of modes of transport is being considered • Also like to be able to visualise probability density functions of ‘possible’ movement
Final remarks • Motivated the need for techniques/tools to support the visualisation of intelligence-related networks that are geospatial in nature, but can vary over time • May want to fuse non-geospatial network data to present a coherent view • 3D representation may be suitable • Suggested a ‘radio player’ type, animated approach • Any tools developed must be intuitive, easy to use & deliver real immediate benefits