Download
1 / 43
430 likes | 457 Views
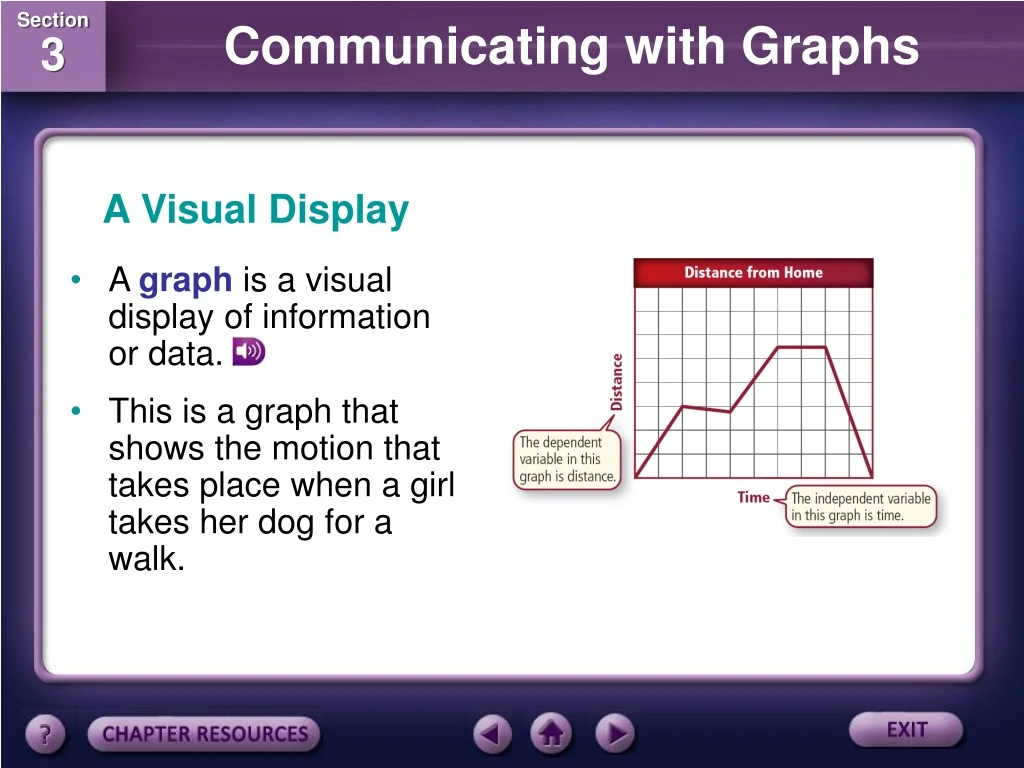
A Visual Display. A graph is a visual display of information or data. This is a graph that shows the motion that takes place when a girl takes her dog for a walk. A Visual Display. The horizontal axis, or the x -axis, measures time.

E N D
A Visual Display • A graphis a visual display of information or data. • This is a graph that shows the motion that takes place when a girl takes her dog for a walk.
A Visual Display • The horizontal axis, or the x-axis, measures time. • Time is the independent variable because as it changes, it affects the measure of another variable.
A Visual Display • The distance from home that the girl and the dog walk is the other variable. • It is the dependent variable and is measured on the vertical axis, or y-axis.
A Visual Display • Different kinds of graphsline, bar, and circleare appropriate for displaying different types of information.
A Visual Display • Graphs make it easier to understand complex patterns by displaying data in a visual manner. • Scientists often graph their data to detect patterns that would not have been evident in a table. • The conclusions drawn from graphs must be based on accurate information and reasonable scales.
Line Graphs • A line graph can show any relationship where the dependent variable changes due to a change in the independent variable.
Line Graphs • Line graphs often show how a relationship between variables changes over time.
Displaying data on line graphs • You can show more than one event on the same graph as long as the relationship between the variables is identical. • Suppose a builder had three choices of thermostats for a new school. • He wanted to test them to know which was the best brand to install throughout the building.
Displaying data on line graphs • He installed a different thermostat in classrooms, A, B, and C. • He recorded his data in this table.
Displaying data on line graphs • The builder then plotted the data on a graph. • He could see from the table that the data did not vary much for the three classrooms. • So he chose small intervals for the y-axis and left part of the scale out (the part between 0 and 15).
Displaying data on line graphs • This allowed him to spread out the area on the graph where the data points lie. • You can see easily the contrast in the colors of the three lines and their relationship to the black horizontal line. • The black line represents the thermostat setting and is the control.
Constructing line graphs • The most important factor in making a line graph is always using the x-axis for the independent variable. • The y-axis always is used for the dependent variable.
Constructing line graphs • Another factor in constructing a graph involves units of measurement. • You might use a Celsius thermometer for one part of your experiment and a Fahrenheit thermometer for another. • You must first convert your temperature readings to the same unit of measurement before you make your graph.
Constructing Line Graphs • Scientists use a variety of tools, such as computers and graphing calculators to help them draw graphs.
Bar Graphs • A bar graph is useful for comparing information collected by counting. For example, suppose you counted the number of students in every classroom in your school on a particular day and organized your data in a table.
Bar Graphs • You could show these data in a bar graph like the one shown.
Bar Graphs • As on a line graph, the independent variable is plotted on the x-axis and the dependent variable is plotted on the y-axis.
Bar Graphs • You might need to place a break in the scale of the graph to better illustrate your results.
Circle Graphs • A circle graph, or pie graph, is used to show how some fixed quantity is broken down into parts. • The circular pie represents the total. • The slices represent the parts and usually are represented as percentages of the total.
Circle Graphs • This figure illustrates how a circle graph could be used to show the percentage of buildings in a neighborhood using each of a variety of heating fuels.
Circle Graphs • To create a circle graph, you start with the total of what you are analyzing.
Circle Graphs • This graph starts with 72 buildings in the neighborhood.
Circle Graphs • For each type of heating fuel, you divide the number of buildings using each type of fuel by the total (72).
Circle Graphs • You then multiply that decimal by 360 to determine the angle that the decimal makes in the circle. • Eighteen buildings use steam. Therefore, 18 72 x 360 = 90 on the circle graph. • You then would measure 90 on the circle with your protractor to show 25 percent.
Section Check Question 1 A graph is a(n) __________ of information or data. A. list B. analysis C. visual display D. conclusion
Section Check Answer The answer is C. Graphs make complex patterns easier to understand by displaying data in a visual manner.
Section Check Question 2 Which of the following types of graphs would be the best choice for representing a child’s growth over time? A. line B. bar C. circle D. contour
Section Check Answer The answer is A. Line graphs often show how a relationship between variables changes over time.
Section Check Question 3 You need to draw a circle graph to represent the following data. Determine the angle on the circle that accurately represents the number of Spanish-speaking households.
Section Check Answer There are 327 households, 179 of which are Spanish-speaking. 179 is 55% of the total, so the angle will be 55% of 360º, or 198º.
What is technology? • Technology is the application of scientific knowledge of materials and processes to benefit people. • Technology can be: • any human-made object • knowledge or skills needed to operate a human-made object • a system of people and objects used to do a particular task
What is technology? • Technology also can be the knowledge or skills needed to perform a task. • A network of people and objects that work together to perform a task also is technology. • A technological system is a collection of the other types of technology that are combined to perform a specific function.
Technological methods or techniques • Long ago, people would sit for hours copying each page of a book by hand. • Books were expensive and bought only by the very rich. • Today, books can be created in different ways.
Global Technological Needs • Technological solutions in developing countries focus on supplying basic needs for families. • Technology that would supply adequate and safe drinking water and food supplies would be valued.
Industrialized Countries • Because the needs for survival are met in industrialized nations, money often is spent on technology. • Technology is designed to improve the quality of life of individuals.
Social Forces that Shape Technology • Society is a group of people that share similar values and beliefs. • The development of technology is affected by society and its changing values, politics, and economics.
Social Forces that Shape Technology • If consumers fail to buy a product, companies usually will not spend additional money on that type of technology. • People will support the development of technologies that agree with their personal values, directly and indirectly.
Economic Forces that Shape Technology Private foundations • A private foundation, which is an organization not associated with the government, is a group of people who work together for a common goal. Federal government • One way in which funds are allocated for research and development of technology is through the federal government.
Moral and Ethical Issues • Ethical issues in science pose questions and establish rules about how scientific hypotheses should be tested and how society should use scientific knowledge. • Ethics help scientists establish standards that they agree to follow when they collect, analyze, and report data.
Section Check Question 1 Scientific knowledge used to solve a problem or provide for a human need is called _______. A. innovation B. invention C. technology D. theory
Section Check Answer The answer is C. Technology is the use of science to solve many different kinds of problems.
Section Check Question 2 Which of the following is a true statement about technology? • Technology has not changed in the last 100 years. B. Technology is used only in industrialized countries. C. People all over the world use technology in the same way. D. Technology can be used to supply basic needs to families.
Section Check Answer The answer is D. Technology is used in many different ways by people all over the world.