Download
1 / 21
210 likes | 309 Views
The Utility of the Bays Eutrophication Model in the Harbor Outfall Monitoring Program. James Fitzpatrick HydroQual, Inc. September 22, 1999. Objectives of Water Quality Modeling. Define Cause and Effect Relationships Define Impacts of Pollutant Sources Assess Required Levels of Control

E N D
The Utility of the Bays Eutrophication Model in the Harbor Outfall Monitoring Program James Fitzpatrick HydroQual, Inc. September 22, 1999
Objectives of Water Quality Modeling • Define Cause and Effect Relationships • Define Impacts of Pollutant Sources • Assess Required Levels of Control • Evaluate Planning Alternatives for Water Quality Management • Focus Additional Monitoring and Research Needs • Assess Future Water Quality Conditions
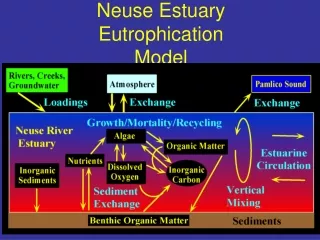
Concerns Inflow Outflow Human Health Contaminants Bacteria Viruses Bioaccumulation Ecological Nutrients Contaminants Organic Material Food Chain Community Structure Living Resources ATMOSPHERE Light GasExchange WATER COLUMN N2, |O2, CO2 Mammals Planktivorous Fish Sources Rivers Boundary Nonpoint Effluents Piscivorous Fish Phytoplankton Dissolved Zooplankton Demersal Fish Microbes Particulate Detritus Regeneration Epibenthos Microbes N, P, Si, O2, CO2 SEDIMENT Infauna
BEM Model Chlorophyll Comparison 1992-1994 Solid lines are the modeled response in Chlorophyll in the surface waters Open circles depict monitoring results
BEM Model Particulate Organic Carbon Comparison 1992-1994 Solid lines are the modeled response in POC in the surface waters Open circles depict monitoring results
BEM Model 1993 Fall Bloom Event Relationship among carbon, chlorophyll, and cell abundance during the Ocober 1993 Asterionellopsis Glacialis bloom
Regional Primary Production 1993
BEM Model Dissolved Oxygen Comparison 1992-1994 Solid lines are the modeled response in DO in the bottom waters Closed circles depict monitoring results
BEM Model Temperature Comparison 1992-1994 Solid lines are the modeled response in temperature Closed circles depict bottom water monitoring results Open circles depict surface water monitoring results
BEM Model Salinity Comparison 1992-1993 Solid lines are the modeled response in salinity Closed circles depict bottom water monitoring results Open circles depict surface water monitoring results
BEM Model DIN Comparison 1992-1994 Solid lines are the modeled DIN response Open circles depict surface water monitoring results
BEM Model Sediment Oxygen Demand 1992-1994 Solid lines are the modeled SOD at selected locations in Massachusetts Bay Closed circles depict monitoring results
BEM Model Effluent Influence Total Nitrogen - Deer Island Total N concentration (solid lines) resulting from the boundary condition and effluent discharged from Deer Island and fraction contribution (dashed line) of MWRA effluent at various locations within Massachusetts Bay.
BEM Model Effluent Influence Total Nitrogen - Mass Bay Outfall Projected total nitrogen concentration (solid lines) resulting from the boundary condition and effluent discharged from Deer Island and fraction contribution (dashed line) of MWRA effluent at various locations within Massachusetts Bay.
BEM Model Predictive Capability Distribution chlorophyll in surface waters under two nutrient loading regimes COL = Current outfall location FOL = Future outfall location
the spatial decrease in phytoplankton biomass in Mass Bay as a function of distance from Boston Harbor the limitation of the winter/spring diatom bloom in Cape Cod Bay by silica the limitation of summer primary productivity by DIN the annual cycle of primary productivity in northwest Mass Bay the annual cycle of DO, with minimum bottom water concentrations occurring in late September and October BEM Model Compatibility to Measured Responses The BEM appears to capture a number of spatial and temporal features of water quality within the Bays during the 1992-1994 time period, including:
BEM Model Limitations • The Asterionellopsis glacialis bloom observed in the fall of 1993, • however, estimates of the magnitude of the bloom may be exaggerated due to low C:Chl-a ratios observed in the A. glacialis • the minimum DO concentrations in the fall of 1994, • however, the model was able to compute minimum DO concentrations that were approximately 1 mg/L lower in the fall of 1994 as compared to 1992 and 1993 The BEM was not able to fully reproduce two of the unique features of the 1992-1994 data set:
BEM Model Utility • BEM is able to reproduce a number of the spatial and temporal features of water quality observed in the 1992-1994 HOM data sets • BEM provides a tool with which to assess the relative importance of various nutrient inputs to the Mass Bays system • BEM provides a tool with which to assess the spatial and temporal effects of outfall relocation and increased nutrient inputs on primary productivity within the Mass Bays system • BEM can also suggest where additional monitoring and field studies need to be performed (e.g., open water boundaries and benthic primary productivity