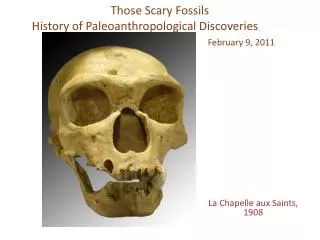
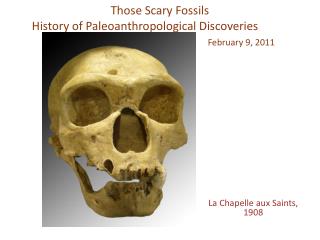
Download
1 / 9
90 likes | 239 Views
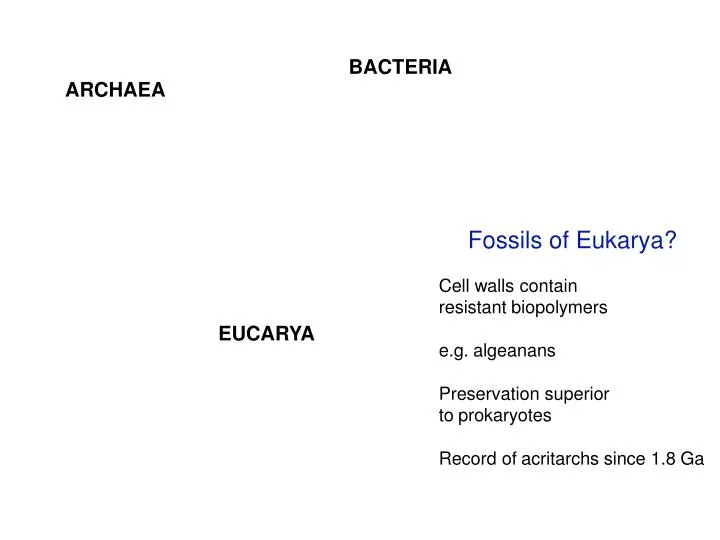
BACTERIA. ARCHAEA. Fossils of Eukarya?. Cell walls contain resistant biopolymers. EUCARYA. e.g. algeanans. Preservation superior to prokaryotes. Record of acritarchs since 1.8 Ga. Zones. new genus. Range-chart plots show four acanthomorph zones. Tanarium irregulare.

E N D
BACTERIA ARCHAEA Fossils of Eukarya? Cell walls contain resistantbiopolymers EUCARYA e.g.algeanans Preservation superior toprokaryotes Record ofacritarchssince 1.8Ga
Zones new genus Range-chart plots show four acanthomorph zones Tanarium irregulare Tanarium conoideum Appendisphaera
Fig.3. Divergence time estimates for major groups of fungi, plants, and animals (Table 1). Thick horizontal bars at branch points are 1 SE; narrow bars delimit 95% confidence intervals; thick bars on branches denote fossil record of fungi; solid circles are calibration points; open circle is internal (fungal) fossil constraint, H, Hemiascomy cetes, The branching order of three groups (Ascomycota, Basidiomycota, Mucorales/Blastocladiales) is shown as unresolved for topological consistency. On the basis of branching order from other data (11, 12), glomalean fungi diverged after chytrids and before the basidiomycotan/ascomycotan divergence, ~1400 to 1200 Ma.
Fossil Lipids lipids from livinghydrocarbon fossils ‘prokaryotes’ • preservation of skeleton & 13C • content ‘bio’ ‘geo’
EUCARYA man animals plants flagellates • micros poridia fungi ciliates slime molds diplomonads BACTERIA green sulfur Sulfolobus bacteria Thermofilum Thermoproteus Des ulfurococcus gram pos itives Pyro ba culum protcobacteria Thermotoga Pyrodictium Pyrococcus Methano- thermus R cyanobacteria Methanobacterium avobacteria Archaeoglobus Halococcus Halobacterium Methanoplanus Methanopyrus Methanospirillum Methanococcus 1 jannaschii 2 igneus Methanosarcina >2.7 Ga • 3thermolithotrophicus • 4vanniellii >2.7 Ga
ComplexityofExtantLife Species Type Approx. Gene Number Prokaryotes Eschericia coli typical bacterium 4,000 Protists 12,000-15,000 7,000 12,500 O. Similis S. Cerevisiae Distyostelium discoideum protozoan yeast slime mould • Metazoan • C. elegans Nematode 17,800 • D. melanogaster Insect 12,000-16,000 • S. purpuratas Echinoderm <25,000 • Fugu rubripes Fish 50,000-10,0000 • Mus musculus Mammal 80,000 • Homo sapiens mammal 60,000-80,000 • After Maynard-Smith and Szathmary, 1999
MajorTransitionsin Origin/EvolutionofLife replicating moleculespopulations of molecules inprotocells independentreplicatorschromosomes RNA as a gene and enzymeDNA genes, protein enzymes • Prokaryotic cellsCells with nuclei & organelles • ieeukaryotes asexual clonessexual populations single bodied organismsfungi, metazoans and metaphytes solitary individualscolonies with non-reproductive castes primate societieshuman societies with language After Maynard-Smith and Szathmary, 1999
Time before present (Ma) • Model for Evolutionof Atm-Ocean • Redox Proterozoic Eon Archean Eon Paleo- Meso- Neo- Fig. 1. Biological and geochemical changes during the Proterozoic Eon. Color gradations denote postulated changes in deep sea redox. (A) Periods of deposition of banded iron formations. (B) Range of values of A34S, the difference in δ34S between coeval marine sulfides and sulfates. Dashed line: 34S= 20%, the maximum Archean valune. Dotted line: 34S= 45%, the maximum fractionation associated with single-step BSR, Asterisk: 34S determined from a single sample, and thus not well constrained. (C) Range of values of Δ34ccarb (after a compilation by A. J. Kaufman). The frequency and magnitude of variations in the Paleoprot- erozoic are somewhat uncertain. (D) Eukaryoyic evolution, as indicated by the first appearances of bidy fossils (solid lins) and molecular biomarkers (dotted lines), including chlorophytes (1), ciliates (2), possibly stemgroups (5), stramenopiles (6), and testate amoebae (7). See text for geochemical references, Fossil distributions from (147). 1. Chlorphytes 2. Ciliates 3. Dinoflagellates 4. Rhodophytes 5.acritarchs 6. Stramenopiles 7. Testate amoebe
Archean 1850-1250 Ma Phanerozoic Upper ocean Transition period Transition period Deep ocean Ocean sediments Fig. 2. Schematic depiction of ettects of changing ocean redox conditions on the depth distributions of Mo (dashed lines) and Fe (solid lines). Influences of nutrient-type depletion and aeolian inputs on surface seawater concentrations are omitted for simplicity. Color gradations are tha same as Fig. 1. During the Archean, oceans are anoxic but not sulfidic. Significant O2 is only associated with cyanobacterial “blooms.” Mo is scare because it is not readily mobilized from crustal rocks during weathering under low PO2. Fe is abundant in the absence of O2 and H2S. From 1850 to 1250 Ma, moderate PO2 oxygenates surface waters but sulfidic deep waters develop. Mo is scarce because of rapid removal in sulfidic waters. Mo is somewhat elevated at the surface because of upper ocean oxygenates and enhanced oxidative weathering. Fe, as in the modern Black Sea, is depleted in sulfidic deep waters, severely depleted in oxic surface waters, and enriched near the redoxcline where both O2 and H2S are scarce. During the Phanerozoic, O2 penetrates to the sediment-water interface. Mo and Fe distributions are similar to today’s. See text for details and references.