Download
1 / 55
610 likes | 932 Views
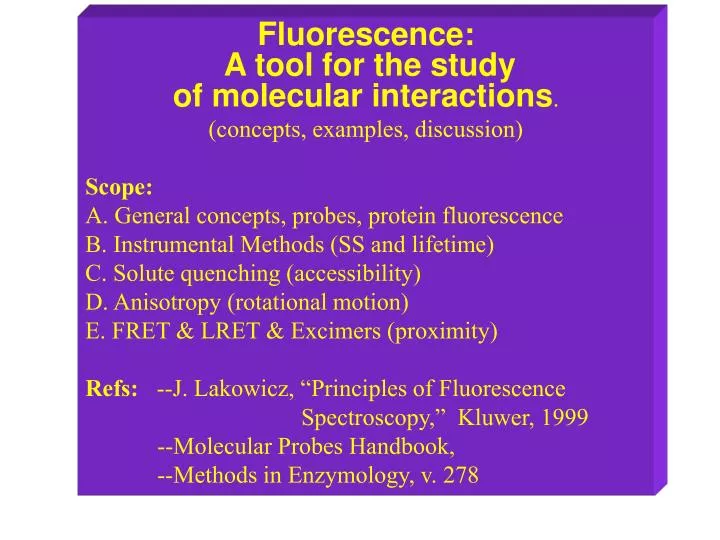
Fluorescence: A tool for the study of molecular interactions . (concepts, examples, discussion) Scope: A. General concepts, probes, protein fluorescence B. Instrumental Methods (SS and lifetime) C. Solute quenching (accessibility) D. Anisotropy (rotational motion)

E N D
Fluorescence: A tool for the study of molecular interactions. (concepts, examples, discussion) Scope: A. General concepts, probes, protein fluorescence B. Instrumental Methods (SS and lifetime) C. Solute quenching (accessibility) D. Anisotropy (rotational motion) E. FRET & LRET & Excimers (proximity) Refs: --J. Lakowicz, “Principles of Fluorescence Spectroscopy,” Kluwer, 1999 --Molecular Probes Handbook, --Methods in Enzymology, v. 278
JABLONSKI DIAGRAM Transitions between quantized energy levels produce the absorption and fluorescence spectra and vibrational substructure. Consequences: 1. Fluorescence spectrum is red shifted from absorption 2. Mirror symmetry of fluorescence and absorption 3. Excitation spectrum should mimic absorption spectrum
JABLONSKI DIAGRAM The excited state can be deactivated by many processes after the solvent relaxes around the excited molecule. Deactivation processes and (rates): 1. Fluorescence ( ) 2. Solute quenching (kq[Q]) 3. FRET (kT) 4. Everything else (ki) 5. Stokes’ shift
Examples of Fluorophors Fluorescent amino acid residues (F,Y,W) (Intrinsic Fluorophors) Membrane Probes Fluorescent nucleic Acid base
(1,3) 1. Lys reactive; 2, Cys-reactive; 3, Environmentally sensitive 4, pH sensitive; 5, Bright; 6, High polarization Examples of Some Fluorescent Labeling Reagents (2,4,5,6) (1,4,5,6) (2,3,6) (1,3) (1,5,6)
Cys Reagents Lys Reagents R1 = dansyl, rhodamine, fluorescein, etc. R2 = protein (From Molecular Probes Handbook) Examples of labeling reactions Can use an asymmetrical disulfide R1S-SR3 (R3=NbS)
Non-covalent probes Note: 1. Can obtain binding stoichiometry and binding constant 2. Information about hydrophobic pockets
Green Fluorescent Protein: A intrinsic probe with visible fluorescence lex= 475 nm; lem= 515 nm
Actin Titration (20X enhancement) (Leavis & Lehrer, 1974) A Hg-based Cys-specific label/probe RSHg+ + PSH = RSHgSP
Some Fluorescence Applications
Actin 17 tyr, 4 trp (Lehrer & Kerwar, 1972) Protein Fluorescence and Environment L-trp,L-tyr,L-phe fluorescence in water Trp spectrum is environmentally sensitive actin fluorescence: Left: G = native; d = denatured; u = in 8 M urea Right:decomposition into trp and tyr components.
(Lehrer & Fasman, 1966,1967) Lysozyme-(NAG)n inhibitor Interactions Inhibitor Complex changes Trp in active site Acidic quenching groups change proximity to Trp
Buried Trp Exposed Trp Trp accessibility and “solute quenching”
Anisotropy and Motion Excitation with polarized light produces polarized fluorescence. The degree of polarization or anisotropy depends on immobilization.
E = 1 - ( DA/ D) or E = 1- (F DA /F D) FRET and association reactions FRET and Distance Measurements FRET = Förster Resonance Energy Transfer
Intensity Measurements
Steady-state Spectrofluorometer Absorption is an absolute measurement F is a relative measurement. F I0 I A= eCl F ≈ QI0 (1 - 10-A) when A < 0.05, F ≈ QI0A Q = (F AR/FRA)QR
ARTIFACTS At A>2, use front face excitation
Examples of Artifacts 900 excitation:filter effect due to overlap of em with ex. Front face excitation filter effect due to more penetration at 365.
Steady-state Spectrofluorometer Absorption is an absolute measurement F is a relative measurement. F I0 I A= eCl F ≈ QI0 (1 - 10-A) when A < 0.05, F ≈ QI0A Q = (F AR/FRA)QR
Lifetime Measurements
Frequency Domain Time Domain Lifetime Measurements When I/Io = 1/e = 0.37, t = . When = 45o, = 1/ = 1/2 For 10 nsec, = 60 MHz
Time Domain vs. Frequency Domain N-acetyl tryptophan amide: an example of a probe with one lifetime
Frequency Domain Sensitivity Frequency range should match lifetime
F0 = 11 + 22 = 5 When + Q, F = 0.5 • 5 + 0.5 • 1 = 3, Therefore, 60% of total F is quenched. For SS, e.g., intensity change could be interpreted as 60% quenching of both, F = 0.5 • 3 + 0.5 • 3 = 3 But lifetime shows that only 1 Trp is quenched by 80%. One trp is v.accessible. With SS can interpret as all partly accessible. Similar problem with FRET. F0 = 5 F = 3 Lifetime data gives more information than intensity data
Collisional Quenching 1. Collisional quenching affects lifetime and intensity, static quenching only affects intensity. 2. Collisional quenching increases with T, static decreases with T. 3. F/Fo = 1/(1+ KQ[Q]), KQ = Stern-Volmer quenching constant, = kqo, kq = collisional constant = ko=1010 M-1s-1 ( =1)
Collisional Quenching of Trp in Proteins Using Iodide and Acrylamide KQ 6.4 M-1 2.8 M-1 (Zhou, Maeda, Mabuchi, Lehrer, JMB,1998) (Lehrer, BBRC, 1967) Acrylamide quenching of the single Trp in LMM monomer (o) and filament (•) Selective quenching of Trp fluorescence (intensity) in lysozyme by I- 1. For multitrp proteins can get fractional fluorescence accessibility 2. Appreciable exposure of trp region ofmyosin rod in filament.
Lysozyme-triNAG skatole L-trp (Lehrer, JACS, 1970) Collisional Quenching by Proton Transfer
Anisotropy, r, and Polarization, p For rigid random probes, rmax= 0.4, pmax = 0.5. r depends on the relationship between the lifetime and the motion.
Anisotropy and Rotational Motion Perrin Equation = lifetime, = rotational correlation time = V/RT = M(v+h)/RT
Perrin Equation = lifetime, = rotational correlation time Steady-state measurements of Anisotropy Example of Immobilization of Probe on tRNA bound to RNA synthetase = V/RT
Anisotropy Decay Measurements-Time Domain r(t) = ro exp (-t/)
Example:Time Domain Anisotropy Decay of LADH measured = 33 ns calculated (0.2g H2O/protein) = 31 ns
Anisotropy Decay Measurement-Frequency Domain 1. At all frequencies, the vertical component has a shorter lifetime so its profile is shifted to higher frequencies. 2. At low frequencies, plenty of time for complete depolarization, so I(ll) = I() 3.. At high frequency the phase shift is maximum for both components.
Is SS value at low frequency, ro at high frequency. Frequency Domain Anisotropy Decay rw = (mll - m )/(mll + 2m)
Simulated Anisotropy Decay for Segmental Flexibility and Protein Rotation (Time Domain)
Mobility of TNS bound to ApoMyoglobin Differential Polarized Phase vs. Time Domain
Uses of anisotropy Measurements 1. Info on size and shape of molecules 2. Info on local probe or segmental motion 3. Binding of labeled small molecule to big molecule. 4. Probe of membrane fluidity. 5. Information for FRET
Proximity via FRET, LRET & Excimers Basics and Examples of FRET
Ro, Critical Transfer Distance = 1 - IDA/ID = 1 - DA/ D
Example: FRET between Trp and Dansyl in Helical Melittin Ro = 23.6A (k2 = 2/3) r = 24,4 A
Distance Distributions A distance distribution analysis might fit better than a 2 or even three lifetime analysis
LRET “Luminescence (Detected) Foerster Resonance Energy Transfer” (LDFRET)
LRET Across Actin Filament Tb-chelate Rh-Mal ActinTm structure (Lorenz et al.,1995)
Structure of Tb-chelate A Novel Luminescent Donor Spectra of Cs124 Cs* + Tb Tb* + Cs NbSSCy-DTPA-Tb-Cs124
Chen,Y & Lehrer (2002) Overlap Between Tb+3 Emission and Rhodamine Absorption TbD* + Rh Tb +RhA* msec RhA* Rh + h msec Rh* Rh + h nsec
(Chen &* Lehrer, 2002) msec Decay of Tb directly monitored at 545 nm Indirectly monitored at 565 nm E = 1 - 1.04/1.43 = 0.38 R = Ro[1/E-1]1/6 = Ro(1.63)1/6 R = 61 A