Download
1 / 19
190 likes | 314 Views
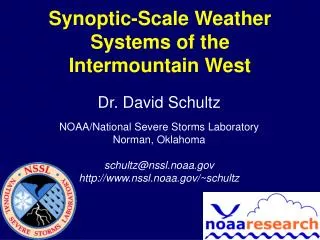
Next-Level ShakeZoning for Earthquake Hazard Definition in the Intermountain West. John N. Louie , with Will Savran , Brady Flinchum , Gabriel Plank, Graham Kent, Kenneth D. Smith Nevada Seismological Laboratory Satish K. Pullammanappallil, Aasha Pancha Optim Seismic Data Solutions

E N D
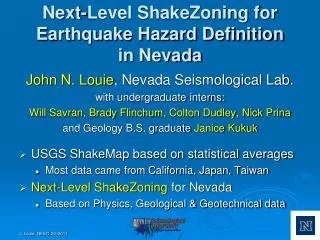
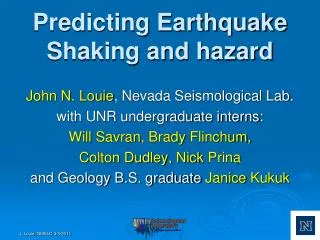
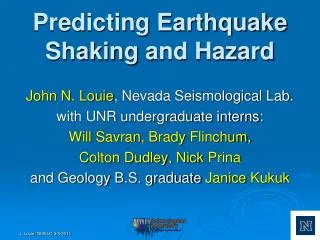
Next-Level ShakeZoning for Earthquake Hazard Definitionin the Intermountain West John N. Louie, with Will Savran, Brady Flinchum, Gabriel Plank, Graham Kent, Kenneth D. Smith Nevada Seismological Laboratory Satish K. Pullammanappallil, AashaPancha Optim Seismic Data Solutions Werner K. Hellmer Clark County Dept. of Development Services
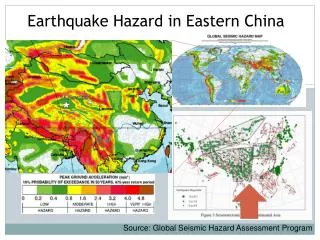
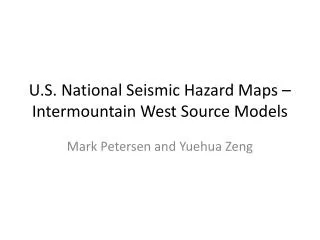
Seismic-Hazard Mapping in Nevada • Goal is to predict earthquake shaking • For hazard mapping, planning • Building-code development and enforcement • Provide time histories of shaking to designers • Shaking characteristics of Nevada geology affect NTS data sets and arrays • USGS ShakeMap • Based on statistical averages; sparse data • Most data came from California, Japan, Taiwan– Geology not similar to Nevada
New, Dense Data Sets Enable“Next-Level ShakeZoning” • Next-Level ShakeZoning for Nevada and Intermountain Western US • Based on: Wave Physics • Geological & Geotechnical data • Parcel Map unsurpassed in detail • Validating against Nevada earthquake records • Complete gridding software and data sets available from crack.seismo.unr.edu/ma
Clark County & Henderson Parcel Map 10,721 Measurements Parcel Class for IBC
Build Parcel Map into ShakeZoning Does it Make a Difference? ShakeZoning Geotech Vs30 Map Warmer colors: lower Vs30 (meter) Parcel Map on top of IBC default Vs30
Adding Fault and Basin Geology Black Hills Fault in Google Earth with USGS Qfaults trace USGS Basin Map
Adding Physics • Black Hills M6.5 event • Short trace but 4-m scarps noted • LLNL’sE3D (Larsen)and WPP (Petersson) viscoelastic F-D solutions • 0.5-Hz frequency • 0.20-km grid spacing • A few hours on our small cluster • Mode conversion, rupture directivity, reverberation, trapping within and tunneling between basins
Black Hills M6.5 Scenario Results • Max Peak Ground Velocity (PGV) >140 cm/sec • PGV over 60 cm/sec (yellow) bleeds into Las Vegas basin from an adjacent basin • Large event for a short fault • Unlikely, but add to hazard probabilistically
Surprising Effect of Parcel Map Over IBC Defaults 1-D Amplification Used in IBC, ShakeMap 3-D Amplification from ShakeZoning
ShakeMap versus ShakeZoning Yellow is 60 cm/sec on both Geotech estimated from topography ShakeZoning shows trapping in basins Hazard map is difficult to predict
Wells, NV M6.0 2/21/2008 • NW-steep-dip fault from initial DregerCMT • Eastward rupture directivity • Many basins channel shaking
Wells, NV M6.0 2/21/2008 • PGV map • Eastward rupture directivity • Many basins channel shaking
With Many Scenarios, Define Probabilistic Hazard dePolo, 2008, NBMG Map 167 • Japan and New Zealand Lesson: Don’t Ignore Worst Case!
Parcel Mapping Surface-Wave Arrays Every One Hand-Modeled
Blind Tests of Parcel Map • Different: • Equipment • Field crew • Dispersion interpreter • Vs(z) modeler • Match to Map Values: • 6 of 93 blind tests >10% off • 13.55% max diff. • 0.26% bias of average • 4.92% RMS difference
Frenchman Mountain Fault M6.7 Scenario Possible Scarp in Neighborhood Event Inside the LVV Basin
With Many Scenarios, Define Probabilistic Hazard • Recurrence Intervals: • Black Hills- 15 ka • Frenchman Mtn.- 45 ka • e.g., PGV at UNLV: • ~20 cm/s from BHF • ~15 cm/s from FMF • Combine rates per annum: • >15 cm/s at 0.0001 p.a. • >20 cm/s at 0.00007 p.a.