Download
1 / 13
130 likes | 242 Views
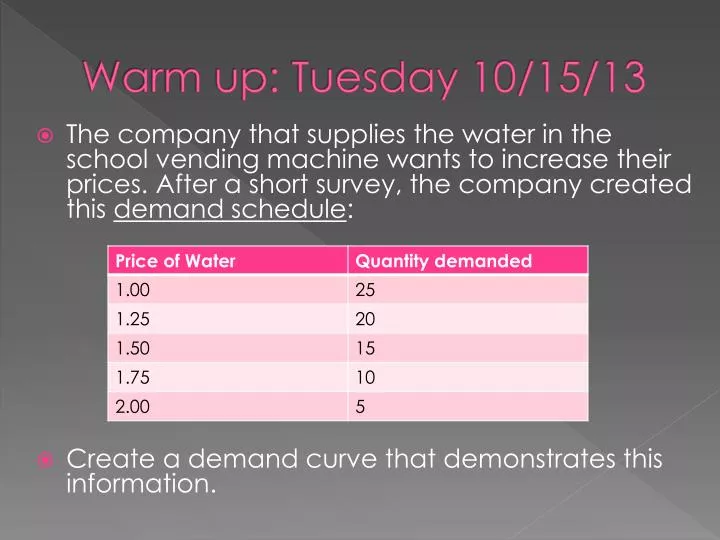
Warm up: Tuesday 10/15/13. The company that supplies the water in the school vending machine wants to increase their prices. After a short survey, the company created this demand schedule : Create a demand curve that demonstrates this information. Demand Shift – period 2.

E N D
Warm up: Tuesday 10/15/13 The company that supplies the water in the school vending machine wants to increase their prices. After a short survey, the company created this demand schedule: Create a demand curve that demonstrates this information.
Warm up: Tuesday 10/15/13 The company that supplies the water in the school vending machine created this supply schedule: Create a supply curve that demonstrates this information. How is this different than what we learned about quantity demanded?
Warm up: Wednesday 10/16/13 The company that supplies the water in the school vending machine created this supply schedule: Create a supply curve that demonstrates this information. How is this different than what we learned about quantity demanded?
Objective: • Students will examine the law of Supply in order to determine how supply effects decision making in the marketplace.
Be careful… • When looking at supply schedules, supply is not necessarily how much sellers will actually sell, but just their willingness to do so. • Ceterus Paribus: keeping all other things constant.
Graphing changes in Supply • Determinants of Supply • Prices / Costs Of Production • Technology • Taxes / Subsidies • Expectations • Number of sellers • Review the Determinants of Supply and create new examples other than the ones listed in the chart.
Supply…Along the curve or of the curve • Along the curve – change in quantity supplied (change in price) • Of the curve – shift in supply (change in a determinant) • Wrap up: So… • How does supply effect prices in the marketplace?
Putting it all together… • Students will assess how demand and supply interact in order to determine how prices are fixed in the marketplace.
Remember equilibrium? • This is a supply and demand schedule for the brand new Playstation 4 that will be released soon. • What would this graph look like?
Surplus vs. Shortage Warm up: Thursday 10/17/13 • Using the following headline, draw a supply and demand curve. • “Popular Sports Figure Signs Endorsement Deal with Shoe Company” • Does this headline illustrate a change in supply or demand? • Does this headline illustrate an increase or decrease? • What happens to the equilibrium price? • What happens to the equilibrium quantity?
Choose one of the following… • Create a supply and demand curve based on one of the following newspaper headlines: • “Hospitals Report Dramatic Decrease in Births” • How does this affect the market for baby strollers? • “Oil Spill in Gulf of Mexico Hurts Crab Population” • How does this affect the market for steamed crabs? • “President Approves Subsidy for Solar Energy Industry” • How does this affect the market for solar panels?
Complete the assessment • Changes in the demand and supply of Gasoline