Download
1 / 26
270 likes | 507 Views
COST ESTIMATION TECHNIQUES AND COCOMO. Cost Estimation Techniques. 1-)Algorithmic cost modelling 2-)Expert judgement 3-)Estimation by analogy 4)-Parkinson’s Law 5-)Price to win. Algorithmic Cost Modelling.

E N D
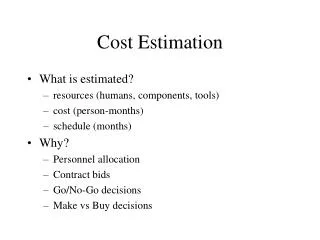
Cost Estimation Techniques • 1-)Algorithmic cost modelling • 2-)Expert judgement • 3-)Estimation by analogy • 4)-Parkinson’s Law • 5-)Price to win
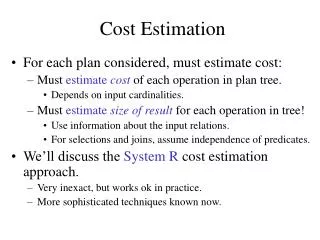
Algorithmic Cost Modelling • Model uses a mathematical formula to predict project costs based on estimates of the project size, the number of engineers and other products.
Expert Judgement • Several experts estimate a project cost. • These estimated costs are compared and discussed. • This process iterates until an agreed estimate is reached.
Estimation by analogy • Cost estimation is done by looking at the previous completed projects.
Parkinson’s Law • The cost is determined by available resources.
Price to win • The estimated effort depends on the customer’s budget and not on the software functionality.
Algorithmic Cost Modelling in Details • Most general form, this model can be expressed as; • Effort = A´SizeB´M • Where A is a constant factor depends on the organisational practices and the type of software that is developed.
Algorithmic Cost Modelling in Details • Size is either code size or the points gathered by function and object points. • The value of exponent B usually lies between 1 and 1.5. Depends on the complexity of the code. • M is calculated by considering some attributes such as dependability requirments and the experience of the development team.
ACM suffers from fundamental difficulties • Size is hard to estimate at an early stage when only a specification is available. Function-points and object-points are easier but, still often in accurate. • The estimations of B and M are subjective.
ACM Info • If you use the model, you should develop a range of estimates(worse,expected and best) and apply the formula for all of them. • More information, more the accuracy of the cost estimation will be.
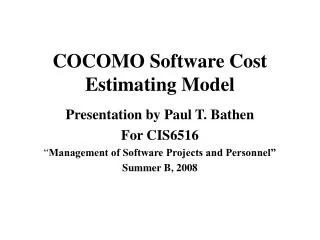
The COCOMO Model • Is an algorithmic model. • Well documented, available in the public domain. • Has been used widely. • Most recent version is Cocomo 2 • Assumes that the software is developed according to a waterfall process. • In the new version, it recognises prototyping, component composition and database programming. • Cocomo 2 supports spiral model.
About the First Version • Three-level model where the levels correspond to the analysis of the cost estimate.
Cocomo 2 • There are sub models that are part of the Cocomo 2 such as; • 1-An application-composition model • 2-An early design model • 3-A reuse model • 4-A post-architecture model
An application-composition model • Assumes that the systems are created by composing existing components. • The formula as follows; PM = (NAP*(1- %reuse/100)) / PROD Where NAP stands for total number of object points. Reuse stands for estimation of the amount of reused code PROD stands for object-point productivity.
An early design model • Once the user requirments are agreed, without a detailed architectural design, this model can be used to estimate. • The formula as follows; PM = A´SizeB´M where A stands for the size of the system. B is not fixed as in Cocomo 81, but it varies from 1.1 to 1.24. M stands for 7 project and process characteristics such as; M = PERS ´ RCPX ´ RUSE ´ PDIF ´ PREX ´ FCIL ´ SCED;
An early design model continues • The list of 7 M project and process characteristics • 1-RCPXreliability and complexity • 2-RUSEreuse required • 3-PDIFplatform difficulty • 4-PERSpersonnel capability • 5-PREX personnel experience • 6-SCEDschedule • 7-FCILsupport facilities
A reuse model • This model is used to estimate the effort required to integrate reusable or generated code. • The formula is ESLOC = ASLOC * (1-AT/100) * AAM. where ESLOC stands for new source code to be coded. ASLOCstands for the number of lines code to be adapted. AT is the percentage of the code to be adapted. AAM is the sum of three components.
A Reuse Model Continues • AAM = AAF + SU + AA • AAF represents the cost of making changes to the reused code. To do this, you have to take into account design, code and integration changes. • SU is the costs of understanding the code. • AA is the costs of reuse decision making. It varies 0 to 8 depending on the amount of the analysis effort required.
A post-architecture model • This model uses the same formula • PM = A´SizeB´M • But with more information about the software to be developed, more attributes are considered, so the estimation becomes more accurate. For example, Size of database used(DATA), Memory constraints(STOR),personnel continuity(PCON)
A post-architecture model continues • For the exponent B is based on five scale factors. These factors are rated on a six-point scale from very low to Extra high(5 to 0). • To calculate B; • B =1.01 + (Sum of ratings) / 100
Calculate the ratings • Precedentedness - new project for the organisation.- rated low (4) • Development flexibility - no client involvement - rated very high (1) • Architecture/risk resolution - No risk analysis – rated very Low .(5) • Team cohesion - new team - nominal (3) • Process maturity - some control - nominal (3)