Download
1 / 14
140 likes | 318 Views
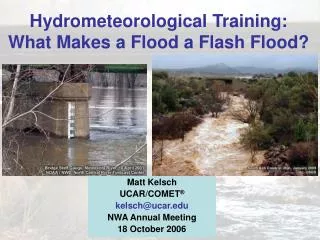
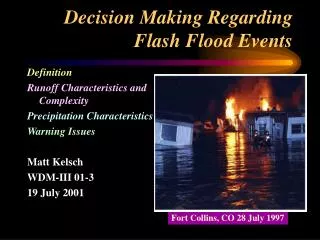
CBRFC Flash Flood Support. Many channels and dry washes duplicate as high use recreational trails. Due in part to the varied terrain and soil types flash floods are not constricted to existing channels. Western Region Flash Flood Factors.

E N D
Many channels and dry washes duplicate as high use recreational trails. • Due in part to the varied terrain and soil types flash floods are not constricted to existing channels. Western Region Flash Flood Factors . . . • Flash floods are generally localized, short-duration events associated with heavy rain. • Flash floods frequently occur in small basins generally less than 20 square miles in size. • Flash floods occur rapidly, frequently on at time scale less than 1 hour. Why the CBRFC uses a customized method… • Precipitation intensity, basin geography and physiographic features have greater influence than antecedent soil moisture. • SAC-SMA calibrated basins are much larger in size than flash flood basins. • SAC-SMA operates on time scales much greater than the flash flood time scale. • It is very difficult to determine a critical flash flood flow/stage level required by earlier methods • SAC-SMA calibrations do not exist across the entire RFC area. • Due to the limitations listed – FFG using SAC-SMA requires significant modification.
Western Region RFC gridded FFG Generation Methods: Geospatial analysis of known flash flood events used to create a GIS model for computing FFG Rules of thumb – skewed and given spatial variability based on the GIS generated flash flood potential index (FFPI). Northwest California - Nevada Colorado Basin Rules of thumb – skewed and given spatial variability based on the GIS generated flash flood potential index (FFPI)
Land Use ? Soil type Vegetation type and density The Flash Flood Potential Index uses information such as land-use, forest density, slope, and soil type to characterize an areas potential response to heavy rainfall Cedar City, UT FFMP Radar Basins Slopes
1 10 FFPI Method Creating a single FFPI layer Hydrologic response 7 3 Slope Greater response and potential 7 8 3 Forest Density Lesser response and potential 8 6 4 Land Use 8 9 6 Soil 9 Flash Flood Potential Index 6 5 8
Decreasing Potential Increasing Potential FFPI in a Gridded Format East Fork of the Virgin River Southwest Utah FFPI 1 10
CBRFC FFPI / FFG Relationship: • Start with reasonable average FFG values of • 1 inch in 1 hour • Assign these values to grid cells with the mean FFPI value of 4 • Incrementally adjust the FFG values up or down as FFPI varies • Limit the range of FFG values to climatologically reasonable values • Verify results by comparing to archived flash flood events & modify The FFPI values range from 1 to 9 with a mean value for the CBRFC near 4 • If FFPI = 4: FFG is 1.00 • If FFPI = 5: FFG is .90 • If FFPI = 6: FFG is . 80 • If FFPI = 7: FFG is .70 • if FFPI = 8: FFG is .60 • if FFPI = 9: FFG is .55 • if FFPI = 3: FFG is 1.45 • if FFPI = 2: FFG is 2.00 • if FFPI = 1: FFG is 2.25
FFG Grid Modified by FFPI FFPI Grid Gridded FFG product for FFMP Initialize FFG Grid Cell 0.7 7 2.3 1 3 1.5 1.0 per 1 hour 1.0 1.0 0.6 4 4 8 0.7 0.9 0.8 5 6 7 If the mean FFPI value for the entire RFC area is 4 thus all FFPI grid boxes of “4” will get assigned the value for the pertinent time period. Other values are scaled up or down by a selected range.
Inputs: Use: Rule of thumb – 1 inch per hour as a starting point Direct use through FFMP - Gridded FFG that uses FFPI Information Stand alone FFPI (D2D, or GIS display package) in a qualitative manner CBRFC FFG Summary: Gridded FFPI - Used to adjust FFG on a grid-cell by grid-cell basis to create greater spatial resolution in FFG and account for physiographic characteristics. Outputs: Gridded FFG that is modulated by the FFPI for input into the FFMP 1, 3, 6, hour gridded guidance provided to FFMP and D2D
CBRFC Flash Flood Guidance Influenced by the Flash Flood Potential Index
Future Operational Concept: Strategy: Model flash floods via hydrologic model DHM-FSR Post- Processor Non-Exceedance values Critical Threshold Frequency Discharge Or SurfaceFlow Grid of Discharge or Surface Flow “The current discharge is in the top 5% of historical responses…”
Frequency Discharge Example Discharge Discharge Frequency Non Exceedance Percentage
Frequency Surface Flow Example Surface Flow Surface Flow Frequency Non Exceedence Percentage
Summary • CBRFC flash flood guidance based on static FFPI grids • Possible to modify for wildfire • Future concept based on distributed hydrologic model; prototyping work at OHD