Download
1 / 29
290 likes | 443 Views
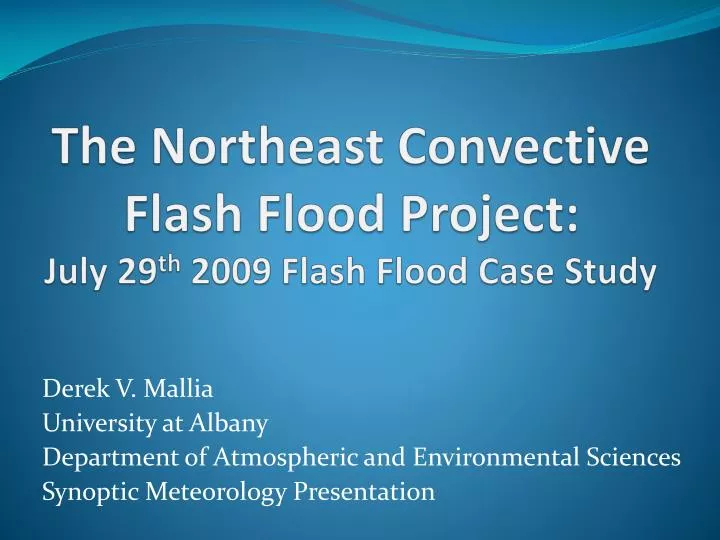
The Northeast Convective Flash Flood Project: July 29 th 2009 Flash Flood Case Study. Derek V. Mallia University at Albany Department of Atmospheric and Environmental Sciences Synoptic Meteorology Presentation. Outline:. Synopsis of case Overview of Synoptic/ Mesoscale Features

E N D
The Northeast Convective Flash Flood Project: July 29th 2009 Flash Flood Case Study Derek V. Mallia University at Albany Department of Atmospheric and Environmental Sciences Synoptic Meteorology Presentation
Outline: • Synopsis of case • Overview of Synoptic/Mesoscale Features • Analysis of indices • Conclusion
Data Sources Used: • Advanced Weather Information Processing System (AWIPS) • Weather Event Simulator (WES) • Rapid Update Cycle (RUC40) (RUC80) • Albany Radar (KENX) • Geostationary Operational Environmental Satellite (GOES)
Synopsis of July 29 2009 Flash Flood Event • Widespread flash flood event • Occurred in: • Saratoga County • Greene County • Rensselaer County • Columbia County • Berkshire County • One day event • Occurred between 17-01 UTC • Frontal case • Associated with cold front over Ontario Lake
Pictures from July 29th Event Courtesy of Brian Frugis and Tim Scrom
RUC 40 500hPa Height and Relative Vorticity 16 UTC 20 UTC Upstream Vorticity Maximums Upstream Vorticity Maximums
RUC 40 250hPa Wind Analysis 16 UTC
RUC 40 250hPa Wind Analysis 20 UTC
RUC 40 250hPa Wind Analysis 00 UTC
RUC 40 PWAT & 850 hPa Wind and Theta-E Advection 16 UTC 16 UTC
Sounding Derived Parameters • CAPE= 2614J/kg“tall and moderate CAPE” • K-Index= 32 • Total Totals= 47 • PWAT= 1.86 in. • Freezing level= 13.9k ft • Dew point= lower 70s F • Max low level wind= 30 kts; southwest
Conclusions: • Dual vorticity and right entrance region of jet provided favorable upper air dynamics • Baroclinic boundary provided focus for precipitation due to isentropic lift. • Plenty of moisture transport into region • High CAPE and moderate K-Index value suggest plenty of instability • Possible topographic effects?
Acknowledgements • Joe Villani; Albany National Weather Service • Neil Stuart; Albany National Weather Service • Julie Gabriel; University of Delaware • Allen Srock; University at Albany • Nick Metz; University at Albany • And the rest of the NWS staff!