Download
1 / 15
150 likes | 294 Views
Irrigation Water Stress Management Study of Vineyard Transpiration With a Sap Flow Meter Author(s): Thibaut Scholasch 1,3 , Jeremie Lecoeur 3 , Laurent Misson 1 and Michael Van Bavel 2 , (1)University of California, Berkeley, ESPM, 151 Hilgard Hall, Berkeley, CA 94720-3110,

E N D
Irrigation Water Stress Management Study of Vineyard Transpiration With a Sap Flow Meter Author(s): Thibaut Scholasch1,3, Jeremie Lecoeur3, Laurent Misson1 and Michael Van Bavel2, (1)University of California, Berkeley, ESPM, 151 Hilgard Hall, Berkeley, CA 94720-3110, (2)President, Dynamax Inc, 10808 Fallstone #350, Houston, TX 77099, (3) Montpellier SupAgro, UMR 759 LEPSE, 2 Place Viala, F34060, Montpellier, France
Vine Sap Flow Water Stress Management • Background: • Water balance models • Rely on correct transpiration rate, Kc varies under RDI • Model transfer under high ET is difficult • Soil Moisture - narrow range especially in RDI • Water Satus by vine water potential: • Time consuming, difficult, not continuous
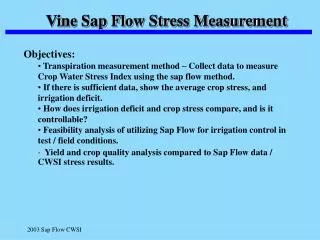
Objectives: • Transpiration measurement method – Collect data to measure Water Stress Index using the sap flow method • Measure the daily crop stress & correlate to • Soil water deficit • ETo and • stem water potential • Implement stress management with automated sap flow systems • Saving: labor, cost, time • Improve resolution - direct water stress measurement
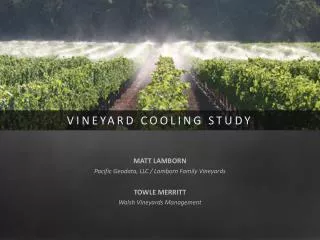
Study outline – May 15- Oct 11, 2006 Private vineyards, Cabernet Sauvignon, 9 yr. old Sap flow sensors – Dynagage Sensors mounted on arms avoiding irregular trunk and Temp. gradients. Soil moisture sensor: C-Probe for 90 cm depth average water content with soil sample calibration. ET provided by nearest network station. Stem water potential readings from PMS pressure chamber, 30 noontime measurements, 3 leaves * 3 vines ea.
Transpiration - Sap Flow Measurements • Transpiration measurement method • (Dynamax Inc, Houston TX) • Dedicated data logger – Flow4 • Two heat Balance sap flow sensors • Parameters for vineyard into Flow4 processor: • Plant Density • Area • Stem area (or leaf area) • Field stem average area (or leaf area index) • Leaf area from physical sampling and Licor leaf area meter. Provides scaling up to vinyard transpiration.
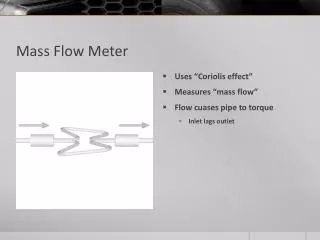
Sap Flow – Dynagage MethodSap Flow sensor operation – Heat Balance Method (SHB) Equations
Sap Flow Sensor Method • Sensor installation: • Sensor with heater wraps all around the Cordons. • Sensor insulated from radiation, stem insulated below and above sensor. • Sap flow sensor measures heat absorbed and temperature rise. Then logger converts results to mass flow. • 4 sensors automatically indexed for vine stem-size to the crop average. • Sap flow results saved hourly and accumulated daily. • Sap flow is converted to mm water used in Flow4.
Sap Flow Water Stress Approach • Perform comparison from demand ETo to actual water transpired • Determine the actual Crop Coefficient (Kc max)on site under well watered conditions. • Measure Sap Flow continuously (ETa), record maximum daily transpiration relative to ETo, (ETm). • Record ETo from automatic weather station. • Kc max = ETm / ETo (mm/mm) • 3) Stress index during any subsequent day by: • Ks = ETa / ETm = Kc adj / Kc max * • where ETm = ETo*Kc (daily) • * FAO Guideline Publication 56, evapotranspiration determined during non-standard conditions such as vines under water stress
Figure 4. Relationship between Transpiration peaks and Irrigation events
Conclusions - Water Stress Index: • Water stress index can be calculated real time with daily tracking of sap flow and ET under field conditions. • The direct relationship between the actual stress coefficient, Ks, and the stem water potential exists • The Sap Flow WSI method provides integration of weather, water application, and plant needs. • ETm and the correlated Crop Coefficient, Kc can be derived at any time with sap flow data, however the irrigation status and water status must be observed.
Conclusions: • Flow4 Sap Flow is sufficiently accurate and responsive to correlate sap flow with ET. Four sensors should be weighted and averaged to the crop results. • Stem Water Potential and the Transpiration Stress are controllable and appear correlated. More data over a complete season is needed for a variety of conditions. 2007 data is undergoing further analysis. • Soil moisture provides a valuable check point for irrigation status. More observations would be required to correlate stress vs soil moisture. Field moisture range is very narrow, and moisture models may not transfer between fields and varieties. • Crop yield and quality compared to Water Stress was measured and will be analyzed in further publications. • THANK YOU ! MORE INFORMATION IS AVAILABLE AT BOOTH 1605, OR WWW. DYNAMAX . COM