Download
1 / 1
10 likes | 157 Views
FENS-2519. Croatian Science Foundation. Abstract.

E N D
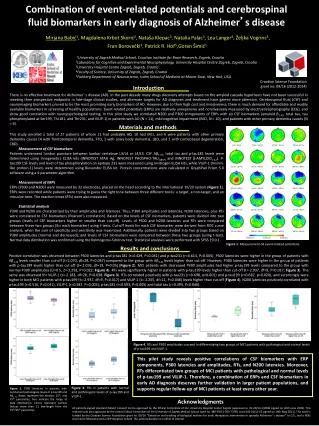
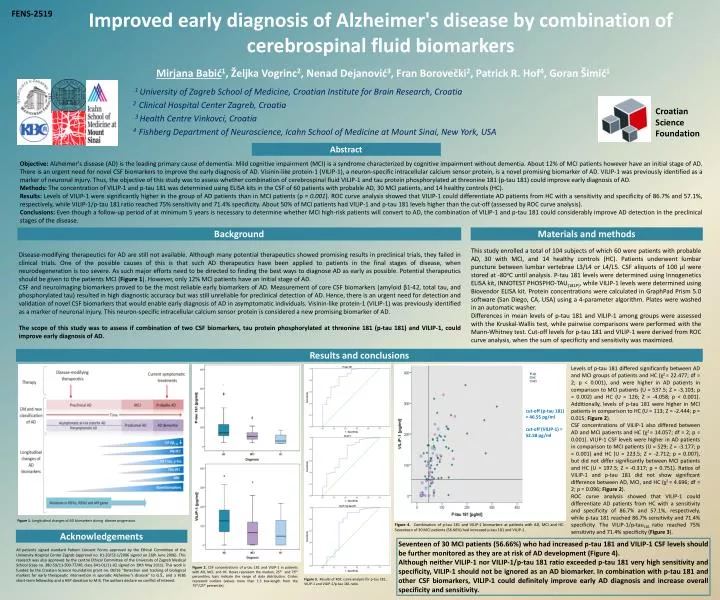
FENS-2519 CroatianScienceFoundation Abstract Objective: Alzheimer's disease (AD) is the leading primary cause of dementia. Mild cognitive impairment (MCI) is a syndrome characterized by cognitive impairment without dementia. About 12% of MCI patients however have an initial stage of AD. There is an urgent need for novel CSF biomarkers to improve the early diagnosis of AD. Visinin-like protein-1 (VILIP-1), a neuron-specific intracellular calcium sensor protein, is a novel promising biomarker of AD. VILIP-1 was previously identified as a marker of neuronal injury. Thus, the objective of this study was to assess whether combination of cerebrospinal fluid VILIP-1 and tau protein phosphorylated at threonine 181 (p-tau 181) could improve early diagnosis of AD. Methods: The concentration of VILIP-1 and p-tau181 was determined using ELISA kits in the CSF of 60 patients with probable AD, 30 MCI patients, and 14 healthy controls (HC). Results: Levels of VILIP-1 were significantly higher in the group of AD patients than in MCI patients (p = 0.001). ROC curve analysis showed that VILIP-1 could differentiate AD patients from HC with a sensitivity and specificity of 86.7% and 57.1%, respectively, while VILIP-1/p-tau 181ratio reached 75% sensitivity and 71.4% specificity. About 50% of MCI patients had VILIP-1 and p-tau 181levels higher than the cut-off (assessed by ROC curve analysis). Conclusions: Even though a follow-up period of at minimum 5 years is necessary to determine whether MCI high-risk patients will convert to AD, the combination of VILIP-1 and p-tau 181could considerably improve AD detection in the preclinical stages of the disease. Improved early diagnosis of Alzheimer's disease by combinationof cerebrospinal fluid biomarkers MirjanaBabić1, ŽeljkaVogrinc2, NenadDejanović3, Fran Borovečki2, Patrick R. Hof4, GoranŠimić1 Background Materials and methods This study enrolled a total of 104subjects of which 60were patients with probable AD, 30 with MCI,and 14 healthy controls (HC). Patients underwent lumbar puncture between lumbar vertebrae L3/L4 or L4/L5. CSF aliquots of 100 µl were stored at -80oC until analysis. P-tau 181 levels were determined using Innogenetics ELISA kit, INNOTEST PHOSPHO-TAU(181P), while VILIP-1 levels were determined using Biovendor ELISA kit. Protein concentrations were calculated in GraphPad Prism 5.0 software (San Diego, CA, USA) using a 4-parameter algorithm. Plates were washed in an automatic washer. Differences in mean levels of p-tau 181 and VILIP-1 among groups were assessed with the Kruskal-Wallis test, while pairwise comparisons were performed with the Mann-Whitney test. Cut-off levels for p-tau 181and VILIP-1were derived from ROC curve analysis, when the sum of specificity and sensitivity was maximized. Disease-modifying therapeutics for AD are still not available. Although many potential therapeutics showed promising results in preclinical trials, they failed in clinical trials. One of the possible causes of this is that such AD therapeutics have been applied to patients in the final stages of disease, when neurodegeneration is too severe. As such major efforts need to be directed to finding the best ways to diagnose AD as early as possible. Potential therapeutics should be given to the patients MCI (Figure 1). However, only 12% MCI patients have an initial stage of AD. CSF and neuroimaging biomarkers proved to be the most reliable early biomarkers of AD. Measurement of core CSF biomarkers (amyloid β1-42, total tau, and phosphorylated tau) resulted in high diagnostic accuracy but was still unreliable for preclinical detection of AD. Hence, there is an urgent need for detection and validation of novel CSF biomarkers that would enable early diagnosis of AD in asymptomatic individuals. Visinin-like protein-1 (VILIP-1) was previously identified as a marker of neuronal injury. This neuron-specific intracellular calcium sensor protein is considered a new promising biomarker of AD. The scope of this study was to assess if combination of two CSF biomarkers, tau protein phosphorylated at threonine 181 (p-tau 181) and VILIP-1, could improve early diagnosis of AD. 1 Universityof Zagreb School of Medicine,Croatian Institute for BrainResearch, Croatia 2 ClinicalHospitalCenter Zagreb, Croatia 3Health Centre Vinkovci, Croatia 4Fishberg Department of Neuroscience, Icahn School of Medicine at Mount Sinai, New York, USA Results and conclusions Levels of p-tau 181 differed significantly between AD and MCI groups of patients and HC (χ2 = 22.477; df = 2; p < 0.001), and were higher in AD patients in comparison to MCI patients (U = 537.5; Z = -3.103; p = 0.002) and HC (U = 126; Z = -4.058; p < 0.001).Additionally, levels of p-tau 181 were higher in MCI patients in comparison to HC (U = 113; Z = -2.444; p = 0.015; Figure 2). CSF concentrations of VILIP-1 also differed between AD and MCI patients and HC (χ2 = 14.057; df = 2; p = 0.001). VILIP-1 CSF levels were higher in AD patients in comparison to MCI patients (U = 529; Z = -3.177; p = 0.001) and HC (U = 223.5; Z = -2.712; p = 0.007), but did not differ significantly between MCI patients and HC (U = 197.5; Z = -0.317; p = 0.751). Ratios of VILIP-1 and p-tau 181 did not show significant difference between AD, MCI, and HC (χ2 = 4.696; df = 2; p = 0.096;Figure 2). ROC curve analysis showed that VILIP-1 could differentiate AD patients from HC with a sensitivity and specificity of 86.7%and57.1%, respectively, while p-tau 181 reached 86.7% sensitivity and71.4% specificity. The VILIP-1/p-tau181 ratio reached 75% sensitivity and 71.4% specificity(Figure 3). cut-off (p-tau 181) = 46.55pg/ml cut-off (VILIP-1) = 52.58 pg/ml Figure 1. Longitudinal changes of AD biomarkers during disease progression. Figure 4. Combination of p-tau 181 and VILIP-1 biomarkers at patients with AD, MCI and HC. Seventeenof30 MCI patients(56.66%) had increased p-tau 181andVILIP-1. Acknowledgements Seventeen of 30 MCI patients (56.66%) who had increased p-tau 181 and VILIP-1 CSF levels should be further monitored as they are at risk of AD development (Figure 4). Although neither VILIP-1 nor VILIP-1/p-tau 181 ratio exceeded p-tau 181 very high sensitivity and specificity, VILIP-1 should not be ignored as an AD biomarker. In combination with p-tau 181 and other CSF biomarkers, VILIP-1 could definitely improve early AD diagnosis and increase overall specificity and sensitivity. All patients signedstandard Patient Consent Forms approved by theEthical Committee of the University HospitalCenter Zagreb (approval no. 01-20/53-1/2006signed on 26th June 2006). This research wasalso approved by the central Ethical Committeeof the University of Zagreb Medical School(case no. 380-59/11-500-77/90, class 641-01/11-02 signed on 19th May 2011).This workis funded by the Croatian Science Foundationgrant no. 09/16 “Detection and trackingof biological markers for early therapeuticintervention in sporadic Alzheimer’s disease”to G.Š., and a FEBS short-term fellowship and a HEP donation to M.B.The authors declare no conflict of interest. Figure 2. CSF concentrations of p-tau 181 and VILIP-1 in patients with AD, MCI, and HC. Boxes represent the median, 25thand 75thpercentiles, bars indicate the range of data distribution. Circles representoutliers (values more than 1.5 box-length from the 75th/25thpercentile). Figure 3. ResultsofROC curve analysis for p-tau 181, VILIP-1 and VILIP-1/p-tau 181 ratio.