Download
1 / 64
640 likes | 780 Views
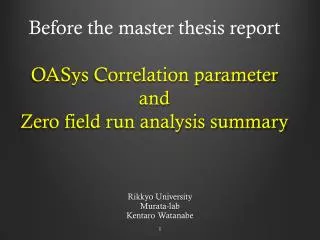
Before the master thesis report OASys Correlation parameter and Zero field run analysis summary. Rikkyo University Murata-lab Kentaro Watanabe. Optical Alignment System. station1. station2. station3.

E N D
Before the master thesis reportOASys CorrelationparameterandZero field run analysis summary Rikkyo University Murata-lab Kentaro Watanabe
Optical Alignment System station1 station2 station3 The OASys is a composed of light sources on the station 1 which are distributed by the optic fiber from a halogen light balb, a convex lenes on the station 2, and a CCD camera at on the station 3. A combination of the light source, the lens and the camera is called as “A single line of the monitor” .There are seven “single lines” on the edge of the octant structure, therefore 7 × 8 = 56 in total for one muonarm. 56 OASYS cameras by each arm. total 112 cameras
How much the size of sagitta from W this study motivetion: The single muon spectrum is dominant with the origin of W in Pt 20〜40GeV. Then, the muon’ssagitta size is how much ? I want to know this value. Magnetic field According tofront page ,The magnetic field intensity is along a line at 15 degrees from the beam axis is 0.75 Tesla-meters(@South). 0.72 Tesla-meters(@North) the muon is flyting 15 degrees
How much the size of sagitta from W Using that information, I have calculated the size of sagitta with followingformula. In here, I supposed the muonalong a line at 15 degrees from the beam axis. ※In here, Pt is defined as the right angle component across the magnetic field. In phnx coordinates, this Pt is Pz. Not using this approximation, I did cross check this value.
How much the sagitta from W The calculation result is following table. It shows the sagittaof muonalong a line at 15 degrees from the beam axis. Over 20GeV ptmuon is almost 5mm curved in Muon Tracker. W signal The size of sagitta from W is about 500μm 〜1mm. ( the muon along a line15 degrees ) This value is consistent withsimulation’s value ?? And I want to know the impact of miss alignment for W
Optical Alignment System The OASYS consists of a light source at station 1, a convex lens at station 2, and a CCD camera at station3. When an individual station moves, the image on the CCD camera moves reflecting the station movement. By observing the position of the light spot on the image of the CCD camera, we can monitor each station’s movement. ④ ⑤ ③ half octant half octant ⑥ ② Seven CCD cameras have been set up to each octant as in a diagram. Horizon direction and vertical direction are defined as x and y. The plane of the CCD camera are mounted almost parallel to the camber plane, the OASys can measure the movement on the X-Y plane, which is direction of the track bending. ① ⑦ We use a halogen lamp and optical fiber as a light source for the OASYS. Optical fibers guide light from the halogen lamp It is attached on the edge of station1.
Optical Alignment System CCD cameras used in OASYS have 8.8mm(768(horizontal) pixel) ×6.6mm (498(vertical) pixel) acceptance. Size of 1 pixel segment is 11.0μm(horizontal) × 13.0μm(vertical). However, when the video signal is read in a PCI capture board, only 640 pixel (horizontal) × 480 pixel (vertical) range is selected. capture raw data image projection X projection Y Projection Method 1. Make 640 × 480 sized 2-dimension array from CCD image. An element means brightness on the pixel. 2. Search for a peak position of the image array, and make projection around peak with 100 pixel range. 3. The method of “projection” is defined as the sum of pixels in the effective range. Resolution for the CCD camera The typical brodimage The typical sharp image The results of measurement are peak position distributions for 1000 samples obtained within 30 minutes. The typical sharp imageand the typical broad image are displayed. The measured resolution is 1.4 μm for sharp image, and 3.1 μm for the broad image. resolution is 3.1 μm resolution is 1.4 μm
Optical Alignment System the focus of some OASYS cameras is not good. These camera’s projection peak can not gauss fit, therefor the center of peak is cut off contribution of fitting. this area not entry fitting this area not entry fitting not good peak not good peak Displacement Sample Picture Normalize vertical (first day opsition) Range : -15[pixel] to 15[pixel], Horaizontal Range : 2010/1/10~2010/4/20 South arm camera 50 direction X South arm camera 50 direction Y 70μm 50μm
Optical Alignment System All camera X direction North Arm 12 camera broken Normalize vertical (first day opsition) Range : -15[pixel] to 15[pixel], Horaizontal Range : 2010/1/10~2010/4/20 All camera X direction South Arm 3 camera broken
OASys Correlation Parameter OASysはMuontracking chamberと一体であり、そのOASysのシグナルはchamberの動きを完全にトレースしているものと考えたい。しかし、実際にはOASys自身の系で独立なパラメターが存在するため、OASysの画像にはchamberの動き以外の要因が混在しているだろう。というのが現状の理解である。
温度 温度に相関がある事は確かである。現時点で最もOASysの存在意義を脅かす存在。Muon Magnetの発熱だけによるチェンバーの膨張/収縮は簡単なモデルで表せないようにみえる。詳細記述はintoro以降。 湿度 湿度がOASysのシグナルに影響を及ぼすとすれば、空気内の保湿量による屈折率の変化などが考えられる。しかし、現時点で20%程度の湿度変化ではOASysのシグナルに変化は見られない事を池田解析により確認。 磁場 Muon Magnetのon/offにより、OASysが示す各々のカメラの輝度は変化する事は確実である。そして、その方向は磁場の方向と一致する動径方向である事も確認されている。MuTrチェンバーの動径方向への動きが支配的であり、大きく動いたカメラで 100μ m 程度動いているように見える。しかし、MuTrチェンバーの動径方向の位置分解能は 300μm 程度し かないため 100μm 程度の動きなら無視する事が出来る。そのため、磁場による MuTrチェンバーの動 きは無視する事が出来ると言える。 その他の外力 重力:MuTr自体の重み、1008全体の沈降。 朝夕力:月の引力によるチェンバーの歪み、または地面の隆起沈降。
根本的にOASysが表したチェンバーの動きというものが正しいのか正しくないのかという検証はOASysとは独立した系でチェンバーの動きを測定し、それとの整合性を測る事で行う。根本的にOASysが表したチェンバーの動きというものが正しいのか正しくないのかという検証はOASysとは独立した系でチェンバーの動きを測定し、それとの整合性を測る事で行う。 その各Stationの相対位置を探るもう1つの手段がZero field runと呼ばれる、磁場をかけない状況下でのmuonの飛跡検出である。この状況下では全てのトラックは直線となり、相対的なミスアライメントの量を推測出来る。ある期間での、このミスアライメントの変化量とOASysが示す所の変化分との相関性を見いだす事が現時点での最重要課題である。 OASYSの動き = ゼロ磁場下でのミスアライメントの量の変化 Re-Alignment PHENIX Physics RUN Re-Alignment zero field run 1st few months few months zero field run 2nd zero field run 3rd OASysdata taking warning!! warning!! と言う事で、まずゼロ磁場での測定結果のまとめッス!!
Zero field 解析Index ・ Zero field run 解析原理 ・ Sagittaの定義と分布 ・ Sagitta分布の考察と検証 – ハドロンdecayの効果:cosmicによる推察。 –muonの運動量依存性:多重散乱のsimulation ・ Fittingfunctionの最適化 ・ ミスアライメントの変化量算出 ・ OASysとの相関
Sagitta Point extarnal point sagitta_r sagitta_y θ track point sagitta_x sagitta_w
External point error estimated external_x track_x[2] track_x[1] track_x[0] track_z[0] track_z[2] track_z[1]
what is the composition sample: south octant8 half2
この形は何から来てるのけ? この形は何から来てるのけ? この形は何から来てるのけ?
Run9 Zero Field Cosmic if this component is consisted from hadron decay, it will be disappeared in cosmic run. To make sure the idea that “2nd gaussian component is hadron decay” is true or not. I have checked the sagitta distribution of cosmic Run9 magnet off cosmic data.
Run9 Zero Field Cosmic Data select requirement ・magnaet off : CMO CMI MMS MMN =0 ・ Partition : Big ・Run Type : CALIBRATION ・ Trigger Config : Calibration ・ before beam :cosmic ・ trigger : MUIDLL1_N1D||S1D Enabled Run Number : 268521, 268543 〜268552
Run9 Zero Field Cosmic South Arm event half octant 1 half octant 2 South North North Arm event The conclusion may be too early to say. However I got a look, 2nd gaissianeffects have not disappeared. These results suggest that the idea of hadron decay is wrong. ← Octant 1と4のcountが少ないのはcosmicの特徴。
Muon momentum study RUN9 January March May motivation: I have to compere the different beam condition data. If the two data’s muon momentum distribution is change, the residual distribution will be change. Especially, if the ratio of low momentum spectrum increase at pp200GeV, the 2nd gaussian component will increase by hadron decay or multiple scattering effect. So, I have checked muon momentum distribution around Zero field run. zero field cosmic 1st zero field 2nd zero field pp200GeV pp500GeV different beam condition
MuonID trigger 2.5GeV/c ← first layer 0 origin 衝突点で発生した粒子はまず NeosCone(銅)と Central Magnet(鉄)を通る。これらの吸収材による反応 長は̃5 程度でこの時点でハドロンの数は 1/100 になる。また、5 層の MuIDには 1 層ごとに鉄が挟まっ ており、μ粒子が MuIDの 5 層目まで到達するには 2.5GeV/C の運動量が必要となる。(←ハドロン吸収材をRun11から導入したから変わった?)
Muon momentum study pp500GeV This spectrum is pp500GeV track associated muonmomentum distribution (No track cut ). under 10GeV 97.3% of ALL !! 500GeV (3104228/3187765) 97.3% momentum [GeV] run condition
Muon momentum study pp200GeV 200GeV (961325/945105) 98.3% under 10GeV 98.3% of ALL !! High pt spectrum seems to decrease than pp500GeV. However under 10GeV muon is 98.3%, high ptmuon is not sensitive for the residual distribution. momentum [GeV] run condition
Muon momentum studysummary 1/p Normalized (〜10GeV) Normalized log scale pp200GeV pp500GeV pp200GeV pp500GeV 0.2GeV 1GeV 1/momentum [/GeV] momentum [GeV] The residual distribution is based on under 10 GeVmuon. The spectrum is same in pp200GeV and pp500GeV. It means the residual from different beam can be compered. And the different of beam is not sensitive 2nd gaussian.
simulation study From zero field cosmic study, we make sure second gaussian component is not based on hadron decay. So, we guess that component will be based on the effect of multiple scattering another momentum. After the last meeting, Oide-san gave me simple multiple scattering root macro. I modified that macro to near real condition. Fist Step : Air volume contribution (fix muon momentum) st3 st1 2GeV muon At first I assumed if 2.0 GeVmuon go through between St1 to St3. Then muon is affected by the effect of multiple scattering from air volume. I want to know the final position (St3) is how much spread by that effect.
station3 でのsagittaを考慮する際のmultiple scattering の効果 external point external point stub point st2 stub point st1 sagitta stub point st3 stub point st3 collision この間での多重散乱の効果はsagittaに影響しない。 つまり、この間での多重散乱の効果を考慮すればよい。
calculation by hand The multiple scattering is roughly Gaussian for small deflection angles, the projected angular distribution, with a width given by The projected y direction distributionis given by @ South station2〜station3 moun momentum : 2GeV x : 160cm air radiation length : 37g・cm^-2 air density : →σ = 469μm
the result of simulation 2GeV muon The cause of fixed momentum 2Gev, it can be fit with single gaussian. This simulation consistent with hand calculation.
different momentum distribution 1GeV fixed RMS: 939μm 2GeV fixed RMS: 470μm 10GeV fixed RMS: 94μm 5GeV fixed RMS: 188μm
different momentum contribution The second gaussian component is appeared !!!
Fit 2gaussian simulation data momentum 1〜10GeV RChiS= 1.1019
Compere with raw data typical raw data South 0ct1-1 pp500GeV-Zerof The Shape of simulation distribution is the same with typical raw data. However, the amplitude is difference…..
A few octant have asymmetry distribution. It is not first priority to find out this asymmetry source. However, I was able to find out that source by simple correlation study. So, today I would like to talk about this study.
Fitting function study This plot is typical sagittadistribution of φ direction. Now, I think this distribution has 3 main componentand it is fit with 2gaussian+pol0function. ( 1st gaus = true signal, 2nd gaus = hadron decay mode, pol0 = noise offset ) However, the problem is 2nd gaussian component is not stable between Run9 march to Run9 may zero filed run. What is this source? The idea of hadron decay mode is true or not. gaussian gaussian pol0
The change of Second gaussian component 上記の通り、2つのガウシアンとpol0でフィッティングを行うと3月のデータと5月のデータで第2ガウシアンのratioが変化しているように見受けられる。特に5月のデータでは、その量が総じて減っている。この理由を考察する事で今までハドロンのdecayとして扱っていた2つ目のcomponentに対して正確にIDする事が今回のstudyの目的である。 Run9 March South Oct8 half1 Rchis: 1.82 Run9 March Norh Oct3 half1 Rchis: 1.24 Run9 May Norh Oct3 half1 Rchis: 170 Run9 May South Oct8 half1 Rchis : 3.07 単純にFitが上手く決まらないのが原因で第2ガウシアンの要素が死んだと考えるもののsample。 Fitは上手くいっていて本当に第2ガウシアンのスペクトルの形が変化したのかもしれない。と思うもの。