Download
1 / 27
270 likes | 382 Views
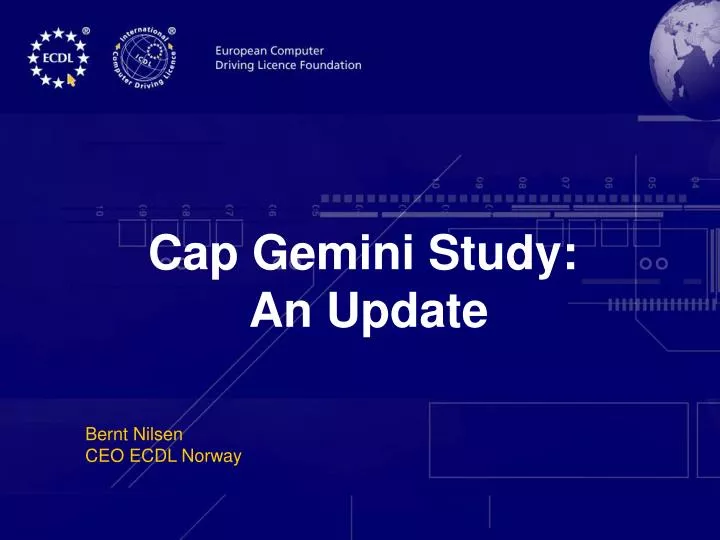
Cap Gemini Study: An Update. Bernt Nilsen CEO ECDL Norway. Contents. Background History, surveys 1996, 2000 and 2001 Results Norway Historical trend Results Finland Comparison results Norway and Finland Calculator – calculation of effect Future plans. www.ecdl.com. Background - 1.

E N D
Cap Gemini Study: An Update Bernt Nilsen CEO ECDL Norway CEO Forum Rome 2003 6/7th November
Contents • Background • History, surveys 1996, 2000 and 2001 • Results Norway • Historical trend • Results Finland • Comparison results Norway and Finland • Calculator – calculation of effect • Future plans CEO Forum Rome 2003 6/7th November www.ecdl.com
Background - 1 • Based on several studies in Norway and Sweden by Cap Gemini Ernst & Young • Assumption that waste of time will be reduced with the spread of wysiwig and increased use of computers • Intended to provide an indication of the extent of computer problems among the parts of the Norwegian population that work with computers every day CEO Forum Rome 2003 6/7th November www.ecdl.com
Background - 2 • ECDL Norway actively promoting the results of this study • Important to shift focus from HW and network connections to the actual use of computers • Government statistics always on HW • Challenged Erkki Liikanen in Oslo CEO Forum Rome 2003 6/7th November www.ecdl.com
Surveys 1996, 2000 and 2001 • Important to document trends • Small change in method • Important to use the same questions to get comparative results CEO Forum Rome 2003 6/7th November www.ecdl.com
Results Norway CEO Forum Rome 2003 6/7th November www.ecdl.com
Time lost • Average time spent on their own and others IT problem is • 136 hours per person pr year (2 hrs 51 min every week) CEO Forum Rome 2003 6/7th November www.ecdl.com
90% Word Processing Email/Calendar 88% Internet 79% Internal Systems 45% Project Mgmt 33% Admin/Personnel 30% 19% Others 0% 20% 40% 60% 80% 100% Tall i % av base 800 When using a PC, which of the following applications do you work with? CEO Forum Rome 2003 6/7th November www.ecdl.com
Helping others 38min Printing Problems 22min 22min Waiting for feedback from support 17min Access to Internal systems Other problems 16min 14min Access to databases 13min Internet Access Email Access and problems 12min 11min Access to WP, SS etc Virus problems 6min Total 171min 0min 50min 100min 150min 200min Average 2001 How much time do you spend on… CEO Forum Rome 2003 6/7th November www.ecdl.com
WP / SS / others 52% Internal systems 18% Email Access and problems 14% Printing problems 13% 13% Internet Access Access to databases 12% Virus problems 1% Waiting for feedback from support 1% 25% Other problems 0% 10% 20% 30% 40% 50% 60% Tall i % av base 800 What are you helping others with….. CEO Forum Rome 2003 6/7th November www.ecdl.com
83% Internal support. 73% Colleagues Wasted time x 2! 44% Outside helpdesk. Support from SW supplier . 35% Support from HW supplier 30% Other 4% No alternative 1% 0% 20% 40% 60% 80% 100% Where can you get help? CEO Forum Rome 2003 6/7th November www.ecdl.com
The role of ECDL • Project Manager for the ICT cost study Øyvind Gladsø says • ECDL is a tool for reducing cost • ECDL should be a requirement for the PC-user • Needs to be mandatory for all users, including managers CEO Forum Rome 2003 6/7th November www.ecdl.com
Historical trend • Average time spent on their own and others IT problem is • 136 hours per person pr year (2 hrs 51 min every week) • Year 2000: 119 hrs • Year 1996: 125 hours CEO Forum Rome 2003 6/7th November www.ecdl.com
Results Finland CEO Forum Rome 2003 6/7th November www.ecdl.com
Problems with Using Information Technology at Finnish Workplaces 16.9.2003 www.ecdl.com
Summary • Background of the study • Summary • Observations • Principal findings www.ecdl.com
TAUSTAA Survey’s error marginal is +- 4,5 % Background of the study • Study consists of 502 respondents. • The research was accomplished by CGE&Y’s and Finnish Information Processing Association's assignment. • Survey was carried out during May-June 2003 by TNS Gallup. • Target group was in companies that employs more than 50 persons. • The study executed nation-wide by using telephone interviews. www.ecdl.com
TAUSTAA According to external study´s, using computers is extensivein Finnish business life. Source: European Third European Survey on working conditions 1996, 2000, Statistics Finland, Tietoyhteiskunnan kehkeytyminen, 2003/3 www.ecdl.com
Summary • In today’s work organisation, using a computer is a prerequisite to successfully carrying out one´s work. • Problems strongly contribute to the dissatisfaction of employees • Training for using software has been given only partially • The efficiency of Finnish companies is compromised due to problems with information technology • Dysfunctional information technology causes interruptions in business processes. • Eight (8) per cent of the total working time of a Finnish employee is spent on problems caused by information technology • Helping one another and problems with Business applications take up a considerable part of the working time. • Finnish medium and large-sized enterprises (more than 50 employees) lose nearly 30,500 man-years annually due to problems with information technology • The cost to the national economy of problems caused by information technology is over € 2,700 million. www.ecdl.com
KESKEISET TULOKSET - YKSILÖN NÄKÖKULMA 8 % of the total working time of a Finnish employee is spent on problems caused by information technology Source: CGE&Y, Problems with Using Information Technology at Finnish Workplaces, 2003 www.ecdl.com
KESKEISET TULOKSET - YRITYKSEN NÄKÖKULMA IT-problems causes annually the lost of nearly 30 500 man-years to Finnish medium and large-size enterprises (more than 50 employees) Assumptions for calculation • In 2001 there were 2 841 companies in Finland that had over 50 employees (Statistics Finland) • These companies employed all together 745 145 people (Statistics Finland) • 51 % of employees spent more than a quarter (1/4) of their working hours for using computers (Third European survey on working conditions 2000). In medium and large-size enterprises this equals 280 024 persons. • 8 % of employees working hours is spent to IT-problems. This equals 30 402 man-years. Source: StatFin: Yritykset henkilöstön suuruusluokittain 2001, Yritystiedot vuodelta 2001, CGE&Y, Problems with Using Information Technology at Finnish Workplaces, 2003 www.ecdl.com
KESKEISET TULOKSET - KANSANTALOUDEN NÄKÖKULMA Share of problem-related expenses in total salary expenses (% and € billion) 4 % 2,73 Total salary expenses in national economy were 66 922 million € in 2001. IT-related problems amount to cost item of nearly 2,7 Euros for the national economy Assumptions for calculation • 51 % of the employees spent more than ¼ of their working time with computers (Third European survey on Working Conditions 2000) • 8 % of users above work is spent to IT-problems. Source: : Statistics Finland, Kansantalouden tilinpito 2001, CGE&Y, Problems with Using Information Technology at Finnish Workplaces, 2003 www.ecdl.com
Comparison Norway Finland -1 CEO Forum Rome 2003 6/7th November www.ecdl.com
Comparison Norway Finland -2 CEO Forum Rome 2003 6/7th November www.ecdl.com
Calculator • Easy, very illustrative way to show the use of ECDL • Based on Cap-study numbers you can calculate the savings for an organisation by using ECDL the first year… CEO Forum Rome 2003 6/7th November www.ecdl.com
Future plans • New study in Norway December 2003 • UK, Ireland plan to join • We would like more countries to join…. • Norwegian study on PC use at home done by Ministry of trade and industry • 67 % have a PC at home – 7 % does not use it • 44 % have had serious problems with the PC the last six months, 22% last month • 50% say they have similar problems at work CEO Forum Rome 2003 6/7th November www.ecdl.com
Contact Details Bernt Nilsen ECDL Norway, Datakortet a.s, P.O. Box 233 N-9915 Kirkenes Ph: +47 (0) 78 97 35 00 Fax: +47 (0) 78 97 35 01 Email: bernt.nilsen@datakortet.no CEO Forum Rome 2003 6/7th November