Download
1 / 37
370 likes | 629 Views
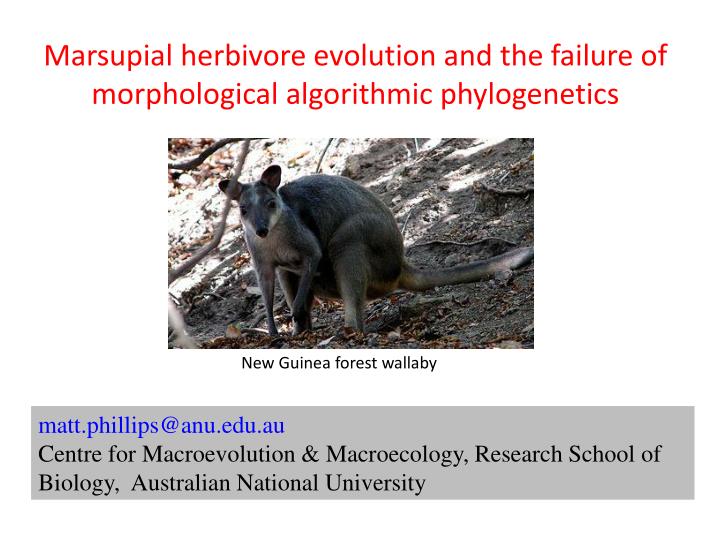
Marsupial herbivore evolution and the failure of morphological algorithmic phylogenetics. New Guinea forest wallaby. matt.phillips@anu.edu.au Centre for Macroevolution & Macroecology, Research School of Biology, Australian National University.

E N D
Marsupial herbivore evolution and the failure of morphological algorithmic phylogenetics New Guinea forest wallaby matt.phillips@anu.edu.au Centre for Macroevolution & Macroecology, Research School of Biology, Australian National University
“Phylogenetics is concerned with the problem of reconstructing the past evolutionary history of extant organisms from present day molecular data” – Phylomania 2010 website Horse evolution & Macroevolutionary theory, e.g. Cope’s rule Darwin’s (the 1st ?) phylogenetic tree
Molecular data: Invaluable for phylogenetic inference Morphological studies had left us with 1.99 1021 possible relationships among the 29 orders Molecular studies now leave us with ≈405 possible relationships Phillips & Penny (2010)
Molecular data: Is molecular phylogeny above the species level a pursuit of diminishing returns (for theoreticians)? Remaining uncertainty involves lineage sorting: genomic retroposons better than species-tree methods for assigning ancestry In either case, the interesting question of individual gene ancestry is defeated by stochastic error
21kb of nuclear genes for 57 marsupial&placental mammals BEAST relaxed clock (lognormal dist. branch rates), 13 FR calibration priors – unconstrained, 20 lineages originate in the Cretaceous 99 mya (83-116HPD) Cretaceous Period Work with Kate Loynes
Rates of DNA substitution (subs/site/Ma) on individual branches Dark blue: unconstrained Light blue: 4 placental lineages in Cretaceous Red: no placentals cross into Cretaceous Cretaceous Tertiary Loynes & Phillips (in prep)
21kb nuclear genes for 57 marsupial & placentals mammals BEAST relaxed clock (as previous) – now constraining ≤4 placental lineages to originate in the Cretaceous 82 mya (73-93HPD) Cretaceous Period
Cut-out section of the placental mammal tree, with putative relationships of fossils from close to or before the K/T boundary More fossils confidently assigned to branches on the modern tree could immediately solve the K/T boundary problem 67 86 All these fossils may be stem placentals Kulbeckia 86 92 And for the overall evolutionary timescale , reduces reliance on assumptions for how rates vary among branches 65
Ancestral state reconstruction Meredith et al (MPE, 2009) Foraging height Arboreality inferred at all deep nodes But megafaunal extinction was biased towards large/terrestrial Palorchestes Include 5 extinct sub-families
“Pull of the recent” peaks Lineage through time analysis Null hypothesis of constant net diversification (speciation-extinction) is linear Marsupial divergence times Ln (accumulated branching events) Penny & Phillips (Nature, 2006) Million years ago Turnover associated with recent biotic/aboitic events overwrites more ancient signals
Hurdles for morphological phylogenetics: progress is being made in some areas • Long branch attraction – A serious problem when MP is standard ML models (e.g. Mk or Mkv of Lewis (Syst Biol, 2001) outperform MP
State 1 State 2 frequency Trait score Other problems include: • Developmental correlations (e.g. upper/lower molars) • Outgroup attraction of ecological long branches (e.g. turtles) • Objectivity in character state discrimination If no clear pattern or unimodal, exclude or score as constant
Functional/ecological correlations • Babies cute/ugly • Wing development slow/rapid • Leg development rapid/slow Pigeon Emu Chicken Ducks Galah Not really three characters providing a strong phylogenetic signal Evolutionarily non-independent, associated with parenting strategy
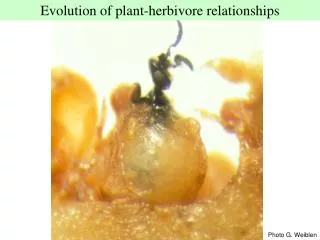
Marsupials arrived in Australasia 55-70 mya from S.America, via Antarctica Microbiotheria Diprotodontia “Polyprotodontia”
Thylacoleo carnifex 110kg Diprotodon opatum ~2500kg Diprotodontia: The most ecologically diverse mammal order Terrestrial herbivores, arboreal insectivores and a multitude of niches in between
Diprotodontia: 10 extant families(≈ 120 species) Vombatidae = wombats (Burrowing grazers) Phascolarctidae = koala (Arboreal folivores) Burramyidae = pygmy possums (Mostly-terrestrial to mostly arboreal gramnivores and generalized omnivores)
Macropodidae = kangaroos and potoroos (Bipedal hopping browsers/grazers and semi-fossorial root/fungi feeders) Tarsipedidae = honey possum (Arboreal nectivore) Hypsiprymnodontidae = musky rat-kangaroo (Terrestrial, bounding frugivore-omnivore)
Acrobatidae = feathertail possums (Gliding/arboreal omnivores) Pseudocheiridae = Ringtail possums (Arboreal folivores) Petauridae = gliders and trioks (Gliding gumnivores and arboreal insectivores) Phalangeridae = Brushtail possums and cuscuces (Scansorial to arboreal frugivores-folivores)
Diprotodontian consensus phylogeny: Cardillo et al. (J. Zool, 2004) Vombatidae (wombats) Vombatiformes Phascolarctidae (koala) Burramyidae (pygmy possums) Tarsipedidae (honey possum) Petauridae (gliders, stripped possums) “Core” Petauroidea Pseudocheiridae (ringtail possums) Acrobatidae (feathertail possums) Phalangeridae (cuscuses and brushtail possums) Macropodidae (kangaroos and potoroos) Macropodoidea Hypsiprymnodontidae (musky rat-kangaroo)
Phillips and Pratt (MPE, 2008): mitochondrial (mt) genomes Beck (J. Mammalogy, 2008): several mt & nuclear genes Meredith et al. (MPE, 2009): 5-nuclear genes Vombatidae Phascolarctidae Acrobatidae Tarsipedidae Petauridae Pseudocheiridae Macropodidae Hypsiprymnodontidae Phalangeridae Burramyidae
Molecular “supermatrix”: 26 marsupials 20,654 nucleotides Complete mt genome protein/RNA coding sequences & 5 nuclear genes (RAG1, BRCA1, IRBP, vWF, APOB) • Analysed as 13 separately modelled process partitions • Mitochondrial protein 3rd codons RY-coded to reduce saturation and compositional non-stationarity
All nodes MrBayes BPP = 1.00 and RAxML BP >95%, (except where noted) wombats koala musky rat-kangaroo kangaroos Diprotodontia pygmy possums cuscuses feathertail possums honey possum gliders ringtail possums bandicoots “Polyprotodontia” marsupial mole 0.97 / 72 dasyurids
Mt sequence analyses MRP supertree summary Single nuclear genes MRP supertree summary Albumin M’CF Baverstock et al. 1990 (review) DNA hybridization Kirsch et al. 1997 (review) Algorithmic morphology morphol352 (MP) Algorithmic morphology morphol352 (ML, Bayesian) Previous work on the family-level phylogeny of Diprotodontia Informal-comparative morphology MRP supertree Algorithmic morphology (MP) MRP supertree summary
Differences between informal-comparative and algorithmic morphology Algorithmic MP, ML etc. Homology, otherwise biology-free Many and varied (inc. bootstrap) Informal-comparative vague Homology, untangling funct/dev correlation form phylogenetic signal Non-statistical Selection criterion Character analysis Hypothesis testing
How do these data / methods perform? One test would be whether or not they reject the molecular consensus - not helpful … Hypothesis testing is difficult with distance methods like DNA hybridization and impossible with informal-comparative morphology Alternative: Likelihood disadvantage on the 20,654 nucleotide molecular matrix for a fairer comparison of data / methods Example: –lnL(consensus) = 121,316.3 –lnL(DNA hybridization tree) = 121,438.2 lnL disadvantage = 121.9
Mt sequence analyses 84.4 Single nuclear genes 96.0 Albumin M’CF 182.4 DNA hybridization 121.9 Algorithmic morphology morphol352 (MP/ML) 594.6 Algorithmic morphology morphol352 (Bayes) 617.5 Likelihood disadvantages Informal-comparative morphology 71.7 Algorithmic morphology (MP) 690.1
5 outgroup taxa Vombatidae 100 Phascolarctidae Acrobatidae 100 95 Tarsipedidae 53 Petauridae 74 87 Pseudocheiridae Macropodidae * Hypsiprymnodontidae 73 Phalangeridae 61 Burramyidae Do the algorithmic analyses just suffer from stochastic blindness? • Scaled the molecular-dated marsupial tree to the treelength of the morphol352 ML tree • Simulated 60,000 character “pseudomorphological” dataset, Sim352 in Seq-gen (JC, equivalent to Mk4). 1000 boots, 352 chs
Vombatidae Phascolarctidae Macropodidae Phalangeridae Pseudoch’idae Petauridae Acrobatidae Burramyidae Tarsipedidae Algorithmic morphology Molecular consensus Vombatidae Phascolarctidae Acrobatidae Tarsipedidae Petauridae Pseudocheiridae Macropodidae Phalangeridae Burramyidae
Can we mimic the real morphological data by combining molecular phylogenetic and ecological signals ? 60,000 characters 5 outgroup taxa Vombatidae Size Diet Phascolarctidae Sim352 phylogenetic signal as per the molecular dated tree, scaled to morphol352 treelength Acrobatidae 0 = <50g 0 = herb Tarsipedidae 1 = 50-200g 1 = sub-herb 2 = 200-800g 2 = omniv Petauridae 3 = 800g-3kg 3 = sub-carn Pseudocheiridae 4 = 3-12kg 4 = carn Macropodidae 5 = >12kg Phalangeridae Burramyidae ordered states
Optimum fit to the molecular consensus tree (0% ecological contribution) Optimum fit to the algorithmic morphology tree (9% ecol. cont.) 0 2 4 % MP tree length disadvantage 6 8 10 0 8 16 24 32 % ecological contribution to MP tree length
Phylo-ecol sim Vombatidae Phascolarctidae Macropodidae Phalangeridae Pseudoch’idae Petauridae Acrobatidae Burramyidae Tarsipedidae Algorithmic morphology Molecular consensus Vombatidae Phascolarctidae Acrobatidae Tarsipedidae Petauridae Pseudocheiridae Macropodidae Phalangeridae Burramyidae Phylogenetic randomization test P-value = 0.00016
Alg. Morphol. tree “True” tree a. MP on morphol352741 steps 782 steps Tempting next move: Reverse engineered phylogeny If the algorithmic morphology (morphol352) data is effectively 91% phylogenetic signal, 9% ecological signal … what if we subtract the 9% ecological signal from the observed signal? b. MP on diet+size: 14 steps 26 steps c. Ave. over 9% “true” TL 61.8 steps 114.7 steps c. Rev Eng Phylogeny (a-c) 679.2 steps 667.3 steps
Improvements Co-inferring the relative weightings of the ecological correlates simultaneously with the relative apparent contributions of phylogenetic and ecological signal Searching tree space for the reverse engineered phylogeny - current phylogenetic programs are well set up for addition of log-likelihoods (e.g. for partitioned data), but not for subtraction
Microraptor Eomaia Molecular tree is employed in the discrimination of apparent phylogenetic and ecological signals - so has some influence on the reverse engineered phylogeny. However, the ultimate aim here is the placement of fossils. The correction for ecological signal (inferred with extant taxa) can be employed for fossil taxa, independent of their DNA
>99% of all species are extinct Their fossils provide the only direct evidence for answering many key questions in macroecology and macroevolution and for calibrating molecular timescales
Acknowledgements • Kate Loynes (ANU, PhD student) • Emily Lake (ANU, Honours student) • Australian Research Council