Download
1 / 30
300 likes | 483 Views
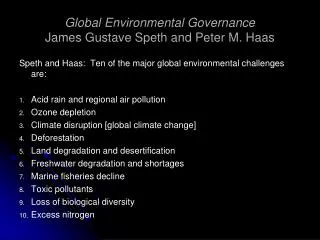
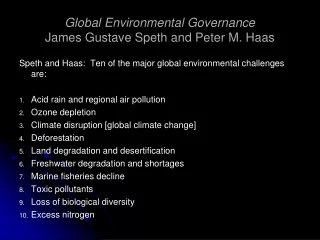
Global Environmental Governance James Gustave Speth and Peter M. Haas. Speth and Haas: Ten of the major global environmental challenges are: Acid rain and regional air pollution Ozone depletion Climate disruption [global climate change] Deforestation Land degradation and desertification

E N D
Global Environmental GovernanceJames Gustave Speth and Peter M. Haas Speth and Haas: Ten of the major global environmental challenges are: Acid rain and regional air pollution Ozone depletion Climate disruption [global climate change] Deforestation Land degradation and desertification Freshwater degradation and shortages Marine fisheries decline Toxic pollutants Loss of biological diversity Excess nitrogen
Acid Rain EPA
Acid Rain Effects Terrestrial Leaches minerals (nutrients, metals) from soil Facilitates desertification Damages leaves of plants Aquatic Irritates gills of aquatic organisms Interferes with gas exchange Erodes slime layer of fishes Reduces resistance to pathogens Erodes shells of aquatic mollusks and arthropods Impedes ability of crustaceans to recalcify after molting Facilitates release of toxins bound to particles in sediments
Air Pollution – Components EPA – NAAQS for six criteria pollutants Particulate matter PM2.5, PM10 Carbon monoxide (CO) Nitrogen oxides (NOx) Sulfur oxides (SOx) Ground-level ozone (O3) Lead (Pb)
PM10 Concentrations, 2005 Red Line: US NAAQS, pre-2006 Matus et al. 2012
Air Quality (Tropospheric NO2) Summer 2006
1945 1960 1974 1990 Bahia http://www.nybg.org/bsci/res/bahia/Defor.html
Tropical Forest Loss Four major types Tropical rain forests More than half in Brazil (41%) and Indonesia (13%) Moist deciduous forests Usually less diverse than rain forests Dry zone forests More than 50% in Africa Tropical upland forests Includes cloud forests Current Status Not all tropical rain forests are the same or under the same pressures Worldwide – ~66% cleared for agriculture Africa – Population growth & subsistence farming Asia – Logging; subsistence farming increasing Latin America – Ranching; subsistence farming increasing
Tropical Forest Loss http://www.fao.org/docrep/t4450e/T4450E0k.htm
Fresh Water Historically limiting factor in arid regions 1940-1990 World population more than doubled 2.3 billion 5.3 billion Per capita water use doubled 400 m3 person-1 year-1 800 m3 person-1 year-1 Global water use increased fourfold 2000: USA ~2000 m3 person-1 year-1 (~1450 galday-1) Current Status In 1996, world human population using estimated 54% of all accessible fresh water in rivers, lakes, aquifers Many people predict disastrous consequences for world’s fresh water supply in coming years This potential disaster may have several causes
Fresh Water Current Status Distribution Uneven compared to population 75% of annual rainfall in areas containing less than one-third of global population Amazon River carries 20% of global runoff through area containing 10 million people Congo River carries 30% of Africa’s runoff through area containing 10% of population Uneven in space North America contains 19,000 m3 per person per year vs. 4700 m3 per person per year in Asia <10% of Mexico supplies >50% of annual runoff Uneven in time India gets 90% of annual rainfall during summer monsoon season (Jun-Sep); runs off too rapidly for efficient use
Fresh Water Current Status Usage patterns Agriculture – 69% Industry/Energy – 23% Domestic – 8% Varies among regions and with development Africa – 88% for agriculture (irrigation) Europe – >50% for industry Japan – Industrial but uses lots of water to grow rice Personal use tracks standard of living Africa – 17 m3 year-1 (12.3 gal d-1) Asia – 31 m3 year-1 (22.4 gal d-1) UK – 122 m3 year-1 (88.3 gal d-1) US – 211 m3 year-1 (153 gal d-1) By 2020, water shortages likely in Ethiopia, India, Kenya, Nigeria, China (parts of China already face problems)
Fresh Water Possible Solutions World may have enough fresh water but inadequate distribution mechanism Long pipelines and movement of icebergs have been proposed Excessively expensive Technological limitations
Fresh Water Possible Solutions Improved irrigation efficiency Drip irrigation reduces losses from evaporation Cuts water use by 40-60% compared to conventional systems Used on <1% of irrigated land worldwide but used extensively in some countries Ex: Israel uses DI on 50% of irrigated land Municipal conservation Infrastructural losses can be substantial Ex: 40-70% of water lost in transit in 15 major Mexican cities (similar rates in India) Ex: Djakarta, Indonesia could cut water losses an estimated 20% by fixing leaky distribution pipes; would save ~12 billion gallons of water a year, enough to supply 800,000 people Higher price could encourage conservation Ex: Bogor, Indonesia increased water prices 3-4x; average household water use dropped by 30% in less than one year
Fresh Water Possible Solutions Reuse of urban wastewater Use of treated wastewater for irrigation Today, at least half a million hectares in 15 countries are being irrigated with “gray water” More water-efficient industry Practiced in industrialized nations. Amount of water needed to produce a ton of steel ranges from 23 to 56 m3 in China, compared to an average of less than 6 m3 in US, Japan, and Germany Desalination 2010: Over 20 billion gallons of fresh water produced daily in ~15,000 facilities worldwide Minimum cost = 0.2¢ gal-1 Current methods of desalination driven almost entirely by combustion of fossil fuels Solar powered desalination plants produced only 1.4 million gal d-1 in 2009
Stratospheric Ozone Depletion Industrial processes release halocarbons and other gases into the atmosphere, reacting with ozone and destroying the ozone layer More pronounced in colder Antarctic than Arctic Reduced protection from harmful ultraviolet radiation Ozone normally reacts with uv light but is regenerated O3 + uv light O2 + O In presence of HCs and other compounds that contain Cl O3 + Cl O2 + ClO
Deforestation Less than 20% of original forest cover remains in many countries Philippines, Madagascar Loss of CO2 uptake capacity Biomass burning Decomposition of organic material Increased erosion/nutrient loss
Water Pollution – Nutrients Nitrogen, phosphorus Common sources Crop and lawn fertilizers Manure Sewage Detergents containing phosphates and nitrates Excessive nutrient loading eutrophication Effects Plant growth can clog waterways (ecology, navigation) Plants can interfere with recreation (swimming, boating) Nighttime oxygen depletion Nitrate methemoglobinemia (blue baby syndrome) Nutrients can be difficult to control once in a system Recycling and regeneration Eutrophied water bodies can recover if sources are removed Ex – Lake Washington