Download
1 / 34
340 likes | 347 Views
Loma Linda University. Economic Impact On The Inland Empire. John Husing, Ph.D. Economics & Politics, Inc. Chief Economist, Inland Empire Economic Partnership. 1. Gold Mine Theory of Local Economics. Secondary Tier. Primary Tier. 2. Money from the Outside World.

E N D
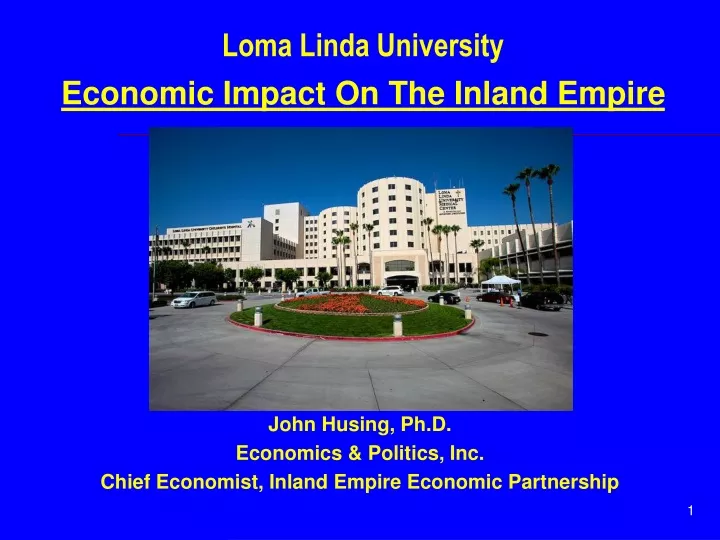
Loma Linda University Economic Impact On The Inland Empire John Husing, Ph.D. Economics & Politics, Inc. Chief Economist, Inland Empire Economic Partnership 1
Gold Mine Theory of Local Economics Secondary Tier Primary Tier 2
Money from the Outside World Money From Non-local Sources Payments MediCare Payments MediCal Federal, State & Private Grants Insurance Company Payments Donations, Endowments Student Fees & Tuition Visitors NOT Local Residents Paying Directly To Use The Hospital or Go To The University 3
Direct Spending: Brings In The Money $1.336 Billion 95.6% 4
Inland Empire Spending On Supplies & Services $367.0 million Southern California Section Inland Empire Other So. California Other Areas Total $10,242,797 $2,166,661 $12,409,458 $5,153,671 $17,563,128 Behavioral Medical Center $376,734 $417,573 $794,307 $1,671,841 $2,466,147 Faculty Medical Groups $291,219,183 $132,377,454 $423,596,636 $185,853,361 $609,449,997 Medical Center $79,491,507 $25,808,149 $105,299,656 $30,096,239 $135,395,895 University $2,575,195 $3,103,429 $5,678,623 $15,081,674 $20,760,297 University Health Care $383,905,416 $163,873,264 $547,778,680 $237,856,785 $785,635,465 Total 70.1% 29.9% 100.0% Inland Empire Share of So. Calif. 48.9% 20.9% 69.7% 30.3% 100.0% Inland Empire Share of Total $383,905,416 95.6% Outside Funds $367,013,578 Inland Empire “Basic” Funds 5
Staff & Employees Total Wage & Salary Employees 15,387 Inland Empire Residents 14,870 Share of Inland Empire 96.6% 6
Inland Empire Payroll: $866 Million Function Payroll @ $52,036 $465,693,087 $16,125,419 $28,960,163 $20,263,321 $101,659,683 $60,180,266 $107,801,172 $800,683,111 12% Benefits Total $521,576,257 $18,060,469 $32,435,383 $22,694,919 $113,858,845 $67,401,898 $120,737,313 $896,765,084 MC (Adult & Children's) Behavioral Medicine University Health Services Faculty Medical Group Faculty Physicans/Surgeons University Health Care Loma Linda University Total Payroll Before Taxes (avg. $58,281) Share of Payroll to Inland Empire Payroll $55,883,170 $1,935,050 $3,475,220 $2,431,598 $12,199,162 $7,221,632 $12,936,141 $96,081,973 96.6% $92,815,186 96.6% 96.6% $773,459,885 $866,275,071 7
Local Inland Empire Spending By Staff: $664 million of $866 million Category Share of Income Spent Amount Share Spent in IE Local IE Spent Food, Personal Services, Utilities, Local Taxes, HH expenses 38.6% $334,375,368 100.0% $334,375,368 HH Equipment, Personal Care Products 2.8% $24,637,570 95.0% $23,405,691 Cash Contributions, Other Vehicle Expensive, Entertainment 9.4% $81,511,485 90.0% $73,360,337 Vehicle Purchases, Major HH Goods, Eating Out 12.6% $109,553,891 85.0% $93,120,807 Apparel, Reading Materials 3.8% $33,083,901 80.0% $26,467,121 Fuel, Entertainment, Education, Pets 7.5% $65,291,021 75.0% $48,968,266 Entertainment, Mortgages, Pension Cost 15.7% $135,623,538 25.0% $33,905,884 Totals 90.4% $784,076,774 80.8% $633,603,474 8
Inland Empire Student Spending: $51.4 million 2007 with CPI ChangeRelatives Spending $10,740 $859,200 $14,320 $887,840 $12,037 $204,629 $16,049 $545,666 $10,740 $107,400 $14,320 $200,480 $16,049 $497,519 $14,320 $400,960 $10,740 $418,860 $14,320 $959,440 $10,740 $225,540 $14,320 $443,920 $12,037 $312,962 $16,049 $609,862 99.0% Off Department Dormitory Total Campus Number Number Budget Number Budget $7,852 $10,470 $7,852 $10,470 $7,852 $10,470 $9,597 $10,470 $7,852 $10,470 $7,852 $10,470 $7,852 $10,470 Spending $369,044 $366,450 $94,224 $125,640 $39,260 $177,990 $95,970 $198,930 $266,968 $973,710 $133,484 $324,570 $62,816 $157,050 95.0% Budget $13,982 $18,643 $13,959 $18,643 $13,959 $18,643 $17,089 $18,643 $13,959 $18,643 $13,959 $18,643 $13,959 $18,643 Spending $3,551,428 $5,462,399 $1,493,613 $6,208,119 $1,298,187 $4,772,608 $2,682,973 $9,023,212 $1,116,720 $2,871,022 $1,019,007 $2,908,308 $586,278 $3,169,310 Spending $4,779,672 $6,716,689 $1,792,466 $6,879,425 $1,444,847 $5,151,078 $3,276,462 $9,623,102 $1,802,548 $4,804,172 $1,378,031 $3,676,798 $962,056 $3,936,222 Allied Health (2nd year on) Dental (2nd year on) SST* (2nd year on) Medicine (2nd year on) Nursing (2nd year on) Public Health (2nd year on) Pharmacy (2nd year on) Non-Local Share 80 62 17 34 10 14 31 28 39 67 21 31 26 38 498 47 35 12 12 5 17 10 19 34 93 17 31 8 15 355 254 293 107 333 93 256 157 484 80 154 73 156 42 170 2,652 90.0% 3,505 New Inland Empire Spending $6,607,535 $3,216,801 $41,546,866 $51,371,202 9
Non-Local Visitor Spending: $51 million Activity Visitor Days Non-Local Number Avg. Spending Spending Board Meetings 75.0% $338 960 720 $243,360 Banquets 50.0% $338 2,266 1,133 $382,954 Convention Attendees 75.0% $225 7,455 5,591 $1,258,031 Continuing Education Classes 63.0% $225 12,454 7,846 $1,765,355 Drayson Center 10.0% $23 377,888 37,789 $869,142 Graduation Guests 90.0% $338 18,900 17,010 $5,749,380 Inpatients (3 not incl pt) LLUMC/CH/ECH 8.0% $169 722,350 57,788 $9,766,167 Outpatients (3 incl pt) LLUMC & BMC 10.0% $113 1,556,998 155,700 $17,594,077 Outpatients Proton (2 incl pt)** 70.0% $113 72,988 51,092 $5,773,351 Outpatients (2 incl pt) FMO 10.0% $56 1,207,782 120,778 $6,763,579 Visitors Touring Campus 75.0% $169 5,559 4,169 $704,565 Kids Care Fair & Other Fairs 15.0% $56 4,725 709 $39,690 Families Bringing Students 90.0% $113 3,277 2,949 $333,261 Volunteer Visitor Days** 15.0% $23 65,223 9,783 $225,019 Totals 4,058,824 473,057 10 New Inland Empire Spending $51,467,930
Total Funds Flowing Into Inland Empire: $644.1 million Contribution to Inland Empire Economic Base Activity Vendor Spending Payroll Spending Student Spending Visitor Spending Total Contribution To Inland Empire Economic Base $367,013,578 $866,275,071 $51,371,202 $51,467,930 $1,336,038,397 11
Economic Impact On Inland Empire Secondary Tier $1.021 Billion Primary Tier $1.336 Billion Impact on Economy: $2.357 Billion 12
Per Capita Taxable Sales Inland Empire City Per Capita Taxable Sales $42,740 $37,540 $33,029 $29,448 $29,252 $27,722 $26,912 $24,315 $23,669 $23,141 Ontario Big Bear Lake Palm Desert Montclair Loma Linda Temecula Barstow Rancho Mirage Chino Norco 15
Per Capita Property Taxes San Bernardino County Per Capita Assessed Valuation $660,116 $140,195 $138,018 $136,252 $127,986 $120,101 $111,285 $80,131 $77,107 $77,077 City Big Bear Lake Chino Chino Hills Ra. Cucamonga Ontario Redlands Upland Fontana Montclair Loma Linda 16
Changing The IE Economic Base Secondary Tier Primary Tier
Inland Empire Job Growth 2011-2016 11% of Job Growth Median Pay $54,261
Inland Empire Underserved by Health Care Workers 26.6% More People Per Health Care Worker in 2015
Training Issue Athletic Trainers & Exercise Physiologists Cardiovascular Technologists and Technicians Coders Dental Assistants Dental Hygienists Diagnostic Medical Sonographers EMTs Massage Therapists Medical Laboratory Techs Medical Records & Health Information Techs Medical Transcriptionists MRI Techs Nuclear Medicine Techs Nursing (RN, LVN, Nurses Aids) Opticians Paramedics Pharmacy Techs Phlebotomists Physical Therapists Physician’s Assistants Physicians Radiological Techs Respiratory Techs
What is Needed To Attack Poverty? •Short Course Adult Training in Specific Skills •Sectors Where Education Barriers To Entry Can Be Overcome • Median Incomes Approaching Middle Class Earnings • Skill Ladders Up Which Workers Can Move To Median Incomes • Sectors That Are Adding Jobs
Training Programs Program 6-18 month certificate programs providing job entry skills, employment and college credit for students who elect to further their education. Entrance Requirement High School Diploma or GED Currently Medical Assistant Promoters Academy Planned Pharmacy Technician Operating Room Technician Occupational Therapist Technician 28
Filling A Need Proposals Funding Research Patents Company Formation Technology Transfer 31
SAN BERNARDINO SHOOTING: Two of five shooting victims at Loma Linda University Medical Center in critical condition (UPDATE) Fighting Ebola Dr. James Appel Dr. Julian Seton 33