Download
1 / 18
180 likes | 437 Views
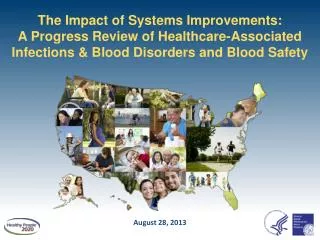
Focus Area 20: Occupational Safety and Health Progress Review. February 18, 2004. Burden of Occupational Injuries and Illnesses. In 2002 Reported 5,524 work-related injury deaths in the U.S. (~15 deaths/day)

E N D
Focus Area 20:Occupational Safety and HealthProgress Review February 18, 2004
Burden of Occupational Injuries and Illnesses • In 2002 • Reported 5,524work-related injury deaths in the U.S. (~15 deaths/day) • Over 4.7 million new nonfatal injuries and illnesses reported in the private industry alone • 4,406,100 injuries • 294,500 illnesses • Occupational injuries and illnesses are estimated to cost: • $45.8 billion - direct costs • $137.4 - $229 billion - indirect costs Source: Census of Fatal Occupational Injuries, BLS; Annual Survey of Occupational Injuries and Illnesses, BLS; The Liberty Mutual Workplace Safety Index, 2003 (Refers to costs for year 2001).
Moving toward target 20-1. Work-related injury deaths 20-2. Work-related injuries 20-3. Overexertion or repetitive motion injuries 20-4. Pneumoconiosis deaths 20-5. Work-related homicides 20-6. Work-related assaults 20-7. Elevated blood lead levels 20-8. Occupational skin diseases or disorders Unable to assess 20-9. Stress reduction programs 20-10. Needlestick injuries 20-11. Noise induced hearing loss* Occupational Safety and Health Objectives + + + Note: +Topics to be highlighted *Developmental objective
Percent of 2010 Target Achieved as of February 2004 Homicides Skin diseases or disorders Non-fatal injuries Overexertion or repetitive motion injuries Injury deaths Pneumo- coniosis deaths Elevated blood lead levels Assaults Note: Percent of Target Achieved = Most recent value – Baseline value Target value – Baseline value
Work-Related Injury Death Rates, 2002 All Industries Deaths per 100,000 workers 4.6 Deaths per 100,000 workers 4.4 2010 Target 4.2 4.0 3.8 3.6 1998 1999 2000 2001 2002 N= 121 N= 789 N= 1,121 N=910 N=5,524 Mining All Industries Agriculture Construction Transportation Obj. 20-1 Note: Rates are calculated for workers 16 and over. Counts are for workers of all ages. Source: Census of Fatal Occupational Injuries, BLS, DOL.
Work-Related Injury Deaths, 2002 Assaults and violent acts – 15% N=5,524 Falls – 13% Exposure to harmful substances and environments – 10% Contact with objects and equipment – 16% Fires and explosions – 3% Transportation – 43% Note: Percentages may not add to totals because of rounding. Source: Census of Fatal Occupational Injuries, BLS, DOL.
Work-Related Injury Death Rates, 2002 Deaths per 100,000 workers 6.9 2010 Target 5.0 4.0 3.9 3.5 0.7 Total Black White Hispanic Females Males Note: Black and White exclude persons of Hispanic origin; Persons of Hispanic origin may be any race. Source: Census of Fatal Occupational Injuries, BLS, DOL. Obj. 20-1a
Work-Related Injury Deaths Among Hispanics, 1995-2000 Rate for all workers, 2000 Construction 1,153 18.3 12.9 20.9 11.8 2.0 2.7 3.3 4.3 30.0 0.9 Agriculture 625 15.3 Transportation 493 10.1 Services 483 2.0 Retail 432 3.0 417 Manufacturing 3.1 4.9 Wholesale 160 109 37.6 Mining Finance 59 1.7 1200 1000 600 400 200 0 20 40 800 Number of deaths Rate per 100,000 workers Source: Census of Fatal Occupational Injuries, DOL, BLS.
Work-Related Injury Deaths Among Hispanics Work-Related Injury Deaths per 100,000 workers (1996-2000) Number of deaths Foreign-born Native-born Source: Census of Fatal Occupational Injuries, BLS, DOL.
Work-Related Injury Deaths Among Workers Under 18 years, 1992-2002 Deaths N = 707 Agriculture Retail trade Construction Services Manufacturing Government Transportation Wholesale trade Other Age Source: Census of Fatal Occupational Injuries, BLS, DOL.
Mining Injury Death Rates, 2002 Deaths per 100,000 workers N=121 N=71 N=25 N=22 Coal mining Oil & gas extraction Nonmetal mining Total Note: Rates are calculated for workers 16 and over. Numbers are for workers of all ages. Total includes three deaths from Metal mining. Source: Census of Fatal Occupational Injuries, BLS, DOL. Obj. 20-1b
Coal, Metal and Non-Metal Mining Injury Deaths, 1998-2002 Underground (N=141) Surface (N=250) Fall of ground Powered haulage Machinery Slip or fall of person Ignition/explosion of gas/dust Other Notes: “Fall of ground” includes “fall of face, rib, pillar, side, or highwall’ and “fall of roof or back” (underground mining). Source: Mine Safety and Health Administration, DOL.
Miners with Coal Workers’ Pneumoconiosis Percent Years worked Number of deaths 1999: 1,003 2000: 950 25+ 20-24 15-19 10-14 <10 1992-1995 1973-1978 1978-1981 1982-1986 1987-1991 1996-2002 Note: Includes only miners who are examined. Source: Coal Workers X-Ray Surveillance Program, NIOSH.
Pneumoconiosis Deaths Number of deaths 2010 Target Coal workers’ pneumoconiosis Other pneumoconiosis Note: Age 15 and over. Source: National Surveillance System for Pneumoconiosis Mortality, NIOSH. Obj. 20-4
Nonfatal Occupational Emergency Department Visits, 1999 Visits per 100 full-time workers Age (years) Source: National Electronic Injury Surveillance System, CPSC and NIOSH.
Nonfatal Occupational Illnesses, 2002 N = 294,500 Skin diseases or disorders Respiratory conditions Poisoning All other occupational illnesses (about 80% of “other” are diseases associated with repeated trauma) Source: Annual Survey of Occupational Injuries and Illness, DOL, BLS.
Dermatitis Cases Rate per 10,000 full-time workers Number of cases Note: Age 16 and over. Cases involving days away from work. Source: Annual Survey for Occupational Illnesses and Injuries, BLS, DOL.
Progress review data and slides can be found on the web at: http://www.cdc.gov/nchs/hphome.htm