Download
1 / 12
120 likes | 206 Views
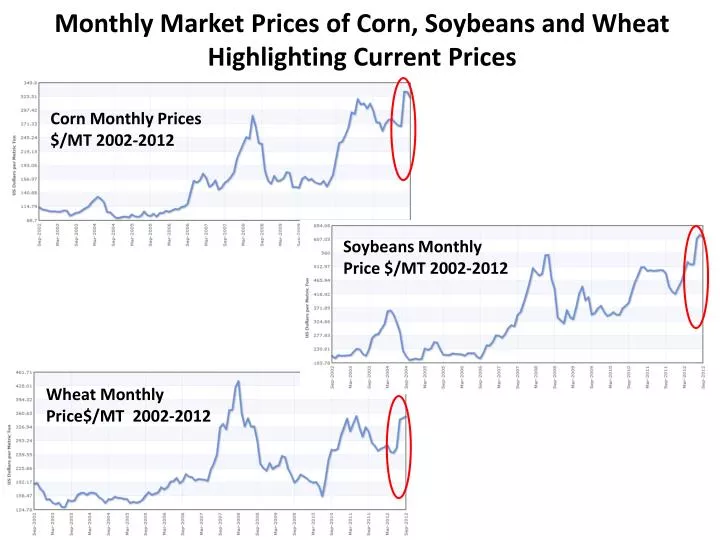
Monthly Market Prices of Corn, Soybeans and Wheat Highlighting Current P rices. Corn Monthly Prices $/ MT 2002-2012. Wheat Monthly Price$/MT 2002-2012. Soybeans Monthly Price $/ MT 2002-2012. The G20 Initiative: GEO-GLAM.

E N D
Monthly Market Prices of Corn, Soybeans and Wheat Highlighting Current Prices Corn Monthly Prices $/MT 2002-2012 Wheat Monthly Price$/MT 2002-2012 Soybeans Monthly Price $/MT 2002-2012
The G20 Initiative: GEO-GLAM • The G20 Cannes Summit (November 2011) Action Plan on Food Price Volatility and Agriculture • Reaffirmed GEOGLAM commitment at the 2012 G-20 Los Cabos Declaration & in Agriculture Ministers Report
Pakistan Agricultural Information System(Collaboration between USDA, FAO, SUPARCO, CRS, & UMD) Crop Condition Crop type classification Yield Forecasting
Mexico Example: Developing a Crop Condition Assessment System
Argentina Example: Developing an EO Crop Condition Assessment System
Mexico & Argentina Examples: Developing National EO Crop Condition Monitoring Systems
WHERE? Cropmask Sources: USGS NLCD (USA), CORINE (Europe), Africover (Africa), South Africa, Zimbabwe (national products), MODIS UMD MCD12q1 (rest of world). compiled by UMD
AT WHAT LEVEL OF DETAIL(SPATIAL RESOLUTION)? Data Source: IIASA, Ecosystems Services & Management, based on interpolation of 50,000 GEOWIKI collected validation points
WHEN? Data source: UMD crop calendar (USA), SAGE crop calendar (rest of world)
WHEN? Data source: UMD crop calendar (USA), SAGE crop calendar (rest of world)
HOW OFTEN? Data source: UMD, based on MODIS Terra data from 2000-2011