Download

1 / 0
10 likes | 236 Views
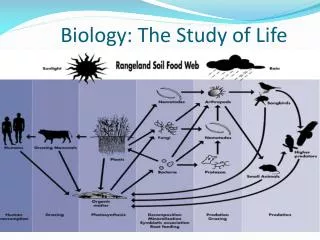
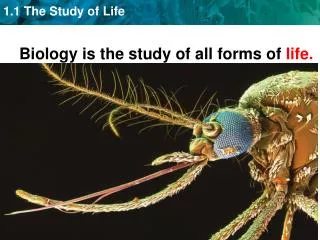
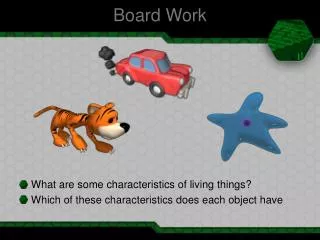
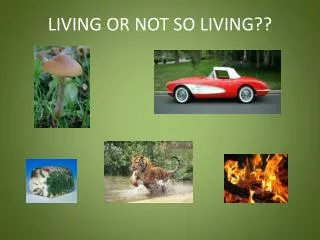
Biology: Chapter 1 Biology: The study of life What do biologists study? 1. The Diversity of Life 2. Interactions between living things and their environment: This helps us understand that no species lives in isolation. The whole planet is interconnected.

E N D