Download
1 / 17
170 likes | 347 Views
The University of Texas at San Antonio. FY 09 Annual Financial Report Highlights January, 2010. Annual Financial Report Highlights. The Annual Financial Report (AFR) is made up of three primary statements with many supporting schedules.

E N D
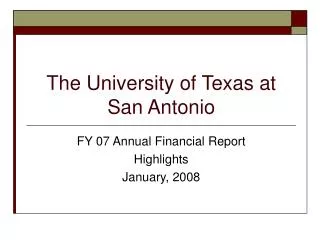
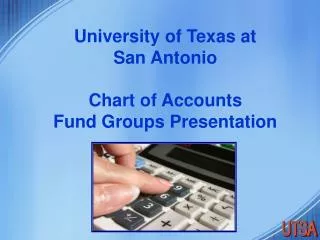
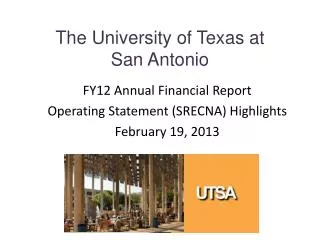
The University of Texas at San Antonio FY 09 Annual Financial Report Highlights January, 2010
Annual Financial Report Highlights The Annual Financial Report (AFR) is made up of three primary statements with many supporting schedules. 1. Balance Sheet – Explains what we own, our obligations and what is available. 2. Statement of Revenues, Expenses and Changes in Net Assets (SRECNA) – Shows the results of operations for the year. 3. Statement of Cash Flows – Shows what revenue came in, what was expended and what is left. Review pie charts and ratios that help explain our financial condition 2
UTSA FY 09Balance Sheet The University of Texas at San Antonio – Balance Sheet ($ in millions) The Balance Sheet has three sections: Assets: What we own - Items that are available to meet operating costs of the Institution, plus buildings, land, equipment, etc. • Investments decreased by $12.7 due to decreases in fair market value. • Capital Assets increased by$24.8M predominantly due to the construction of Engineering Building and other lab renovations. Liabilities: Our obligations -Amounts due and payable within one year or beyond. Net Assets: What’s available - Capital Assets net of depreciation, endowment funds and other unrestricted funds. • Amount invested in Capital Assets increased predominately by $24.8M due to construction. • Unrestricted Net Assets decreased by $11.2Mdue to an increase in operating expenses of $43.3M. Additionally, a decrease in unrestricted quasi endowments due to a decrease in the fair market value of investments.
The Statement of Revenue, Expenses, and Changes in Net Assets (SRECNA) . This statement is called the “Operating Statement” as it reports the results of operations for the year. 2009 2008 UTSA Operating Revenues ($ in millions) UTSA Operating Revenues ($ in millions) 2007 2006 161.5 148.1 Student Tuition and Fees Student Tuition and Fees Net of Discounts - Net of Discounts 143.57 118.7 64.9 Sponsored Programs Sponsored Programs 72.8 79.7 73.2 9.6 Sales and Services of Educational Activities Sales and Services of Educational Activities 6.7 6.0 7.7 Auxiliary Enterprises Auxiliary Enterprises 15.1 17.9 14.2 21.7 Other Other 2.5 3.2 3.1 2.0 • Tuition and Fees increased by $13.4 (9%). Sponsored Programs decreased by $14.8M (18%)due to Pell and State Sponsored Programs being reported as non-exchange sponsored programs and SSEA respectively. • Operating Loss is calculated before State Appropriations. Operating expenses outpaced operating revenues causing an increase of $36.9M(40%). • State Appropriations slightly increased by $.8M (.7%). • Income (Loss) Before Other Revenues decreased by $29.6M (108%)due to decrease in FV of Investments, an increase in Operating Loss, and decrease in investment income. • Mandatory Transfers represent amounts transferred to System to pay debt service and Nonmandatory Transfers represent anticipated bond proceeds transferred to UTSA to fund construction projects. • As on the previous exhibit, Change in Net Assets was $13.0M. This is predominately due to debt issued for construction projects for which bond proceeds are due from System. Total Operating Revenues Total Operating Revenues 240.6 215.3 259.7 256.5 Total Operating Expenses Total Operating Expenses 315.6 293.8 348.7 388.8 (129.1) (92.2) Operating Loss Operating Loss (75.0) Non-Operating Revenues (Expenses): Nonoperating Revenues (Expenses): State Appropriations 98.1 97.1 State Appropriations 115.5 114.7 Gift Contributions 3.8 3.5 Non-Exchange Sponsored Programs 28.7 0.0 Net Investment Income (Loss) 10.9 6.1 Gift Contributions 6.5 5.8 Net Inc. (Dec.) in Fair Value of Investments 12.4 4.1 Net Investment Income (Loss) 4.4 12.7 Gain/(Loss) on State of Capital Assets (0.1) Net Inc. (Dec.) in Fair Value of Investments (28.2) (13.6) Other Nonoperating Revenues/Expenses 0.0 0.0 Income (Loss) Before Other Revenues, Expenses, Gains or Losses (2.2) 27.4 Income (Loss) Before Other Revenues, Expenses, Gains or Losses 50.1 32.2 Gifts and Sponsored Programs .3 .5 Gifts and Sponsored Programs 0.0 0.6 1.5 4.4 Additions to Permanent Endowments Additions to Permanent Endowments 4.0 4.9 Re-Class From (To) Institutions 38.9 97.8 Reclass From (To) Other Institutions (48.7) 19.8 Mandatory Transfers (31.8) (28.3) Mandatory Transfers - Comp & Sys Admin - Debt Svc (19.7) (16.6) Non-Mandatory Transfers 8.5 9.1 Nonmandatory Transfers - Comp & Sys Admin 141.9 28.6 Transfers From (To) Other State entities (2.2) (1.5) Transfers From (To) Other State entities (1.4) Change in Net Assets 126.2 68.7 Change in Net Assets 109.4 13.0 Net Assets, Beginning of the Year 635.1 566.4 Net Assets, Beginning of the Year 870.7 761.3 Net Assets, End of the Year 883.7 870.7 Net Assets, End of the Year 761.3 635.1
The University of Texas at San AntonioFY 09 – Statement of Cash Flows • Cash from operations includes tuition and fees and expenditures for operations includes salaries, scholarship/fellowship and supplies. • Noncapital financing activities include State appropriations and Gifts. • Capital and related financing activities include purchase of equipment and construction of buildings. • Investing Activities include the purchase/sale of investments, interest income and endowment income distribution. • Cash & Cash Equivalents increased by $11.2Mdue to cash provided for noncapital financing. 5
UTSA FY 2009 Sources of Revenue by Category Operating Sources by Category ($ in Millions) 6
UTSA FY 09 Sources of Revenue Operating Sources ($ in Millions) 7
Comparison of Sponsored Programs for FY09 and FY08 FY 08 FY 09 9
Reconciliation:FY 08FY 09 Statement of Revenues, Expensed and 26,773,114 35,929,725 Changes in Net Assets- Research Expenses F+A 5,188,035 6,356,539 Capital Outlay 2,640,2954,235,223 Total Research Expenditures 34,601,444 46,521,487 Reconciliation of Research Expenditures to AFR Operating Expenses - Research 11
UTSA FY 09 Analysis of Financial ConditionComposite Financial Index • Composite Financial Index measures the overall financial health by combining four core ratios into a single score: primary reserve ratio, expendable resources to debt ratio, return on net assets ratio and the annual operating margin ratio. • The CFI decreased by 1.5primarily due to decreasein the fair value of investments of $28.2M, decrease in bond proceeds as a result of completion of several construction projects, and a decline in operating margin. 12
UTSA FY 09 Analysis of Financial ConditionOperating Expense Coverage Ratio • Measures an institution’s ability to cover future operating expenses with available year-end balances. Ratio is expressed in number of months coverage. • Decrease from 5.1 months to 4.2 months is due to decrease in unrestricted net assets as a result of decreases in Quasi Endowments Investments. In addition, operating expenditures have increased by $43.3M. • System satisfactory rating is at two months or above and should be stable or improve. 13
UTSA FY 09 Analysis of Financial ConditionDebt Service Coverage Ratio • This ratio measures the actual margin of protection provided to investors by annual operations. Calculation is used by Moody’s Investment Services, system-wide to determine bond rating. This is watched very closely so UT System can maintain AAA bond rating. • Trend helps to determine if an institution has assumed more debt than it can afford to service. • The debt service coverage declined but still exceeds UT System’s benchmark of greater than 1.8. This means that our net resources are 2.1 times what we are currently expending for debt payments. The ratio decreased as a result of a reduction in operating performance and an increase in debt service. 14
UTSA FY 09 Analysis of Financial ConditionExpendable Resources to Debt Ratio • This ratio measures an institution’s ability to fund outstanding debt with existing net asset balances should an emergency occur. • UTSA’s debt ratio changed slightly due to a increase in debt associated with Engineering Building Phase II. • This ratio shows that more and more of our resources are going towards paying off debt. System’s Satisfactory benchmark is 0.8x or greater. Restated Restated 15
UTSA FY09 Analysis of Financial ConditionDebt Burden Ratio • This ratio examines the institution’s dependence on borrowed funds and cost of borrowing relative to overall expenses. • UTSA’s debt burden ratio increased slightly as a result of a major capital improvements program resulting in increased debt service payments this year of $3.5M. The institution is heavily reliant on debt to fund cost. • System’s Satisfactory benchmark is less than 5.0%. 16
UTSA FY 09 AFR Summary • UTSA continues to receive a “Satisfactory” rating from UT System as a result of a healthy financial condition. • UTSA’s operating margin ratio decreased from 7.3% for FY 2008 to 4.0% for 2009. Expenditures exceeded revenue growth as expected. Strategic initiatives were implemented, new positions were hired, equipment was replaced and planned capital renovations were completed. The university must establish an appropriate level of reserves and closely monitor its debt capacity. 17