Download
1 / 9
90 likes | 220 Views
The University of Texas at San Antonio. FY11 Annual Financial Report Operating Statement (SRECNA) Highlights March 29, 2012. Annual Financial Report Highlights. The Annual Financial Report (AFR) is made up of three primary statements with many supporting schedules.

E N D
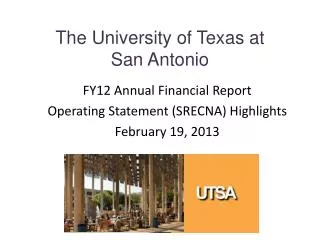
The University of Texas at San Antonio FY11 Annual Financial Report Operating Statement (SRECNA) Highlights March 29, 2012
Annual Financial Report Highlights The Annual Financial Report (AFR) is made up of three primary statements with many supporting schedules. 1. Balance Sheet – Explains what we own, our obligations and what is available. 2. Statement of Revenues, Expenses and Changes in Net Assets (SRECNA) – Shows the results of operations for the year. 3. Statement of Cash Flows – Shows what revenue came in, what was expended and what is left. 2
The Statement of Revenue, Expenses, and Changes in Net Assets (SRECNA) . This statement is called the “Operating Statement” as it reports the results of operations for the year. 2011 2010 UTSA Operating Revenues ($ in millions) UTSA Operating Revenues ($ in millions) 2007 2006 174.3 170.5 Student Tuition and Fees Student Tuition and Fees Net of Discounts - Net of Discounts 143.57 118.7 77.8 Sponsored Programs Sponsored Programs 72.8 64.7 73.2 9.6 Sales and Services of Educational Activities Sales and Services of Educational Activities 6.7 6.0 8.9 Auxiliary Enterprises Auxiliary Enterprises 15.1 14.2 24.0 27.4 Other Other 2.5 2.6 3.2 2.5 • Tuition and Fees increased by $3.8M (2%). • Sponsored Programs increased by $13.1M (20%) due to increase in Texas Grant of $7.3M and Federal Programs of $3M. • Auxiliary Enterprises increased by $3.4M (14%) due to increases in housing, food service and parking revenue. • Operating Loss does not include State Appropriations and Pell revenue. Operating expenses outpaced operating revenues causing a slight increase of $2.8M (22%). • State Appropriations decreased by $8.9M due to budget cuts of $12.4M in FY11 and $3.5M in FY10. • Federal Non-Exchange Sponsored Programs and Non-Exchange Pass Throughs increased due to increase in Pell Awards of $7.4M. • Net Inc. (Dec.) in Fair Value of Investments increased by $5.3M due to a more positive market. • Additions to Permanent Endowments were $15.7M predominately due to McKinney Scholarship Endowment gift of $12.6M. • Mandatory Transfers represent debt service payments and Non-Mandatory Transfers represent anticipated bond proceeds used to fund construction projects. • Change in Net Assets was $56.6M. This is predominately due to increases in FMV of investments and construction projects. Total Operating Revenues Total Operating Revenues 240.6 215.3 291.6 270.7 Total Operating Expenses Total Operating Expenses 315.6 293.8 451.7 428.0 ( 160.1) (157.3) Operating Loss Operating Loss (75.0) Non-Operating Revenues (Expenses): Nonoperating Revenues (Expenses): State Appropriations 98.1 97.1 State Appropriations 112.5 121.4 Federal Non-Exchange Sponsored Programs and Non-Exchange Pass Through Gift Contributions 3.8 3.5 58.5 50.4 Net Investment Income (Loss) 10.9 6.1 Gift Contributions 6.5 8.8 Net Inc. (Dec.) in Fair Value of Investments 12.4 4.1 Net Investment Income (Loss) 12.1 8.7 Gain/(Loss) on State of Capital Assets (0.1) Net Inc. (Dec.) in Fair Value of Investments 23.0 17.7 Other Nonoperating Revenues/Expenses 0.0 0.0 Income (Loss) Before Other Revenues, Expenses, Gains or Losses 52.5 49.7 Income (Loss) Before Other Revenues, Expenses, Gains or Losses 50.1 32.2 Gifts and Sponsored Programs .1 .3 Gifts and Sponsored Programs 0.0 0.6 15.7 Additions to Permanent Endowments 10.2 Additions to Permanent Endowments 4.0 4.9 Re-Class From (To) Institutions (41.4) 13.0 Reclass From (To) Other Institutions (48.7) 19.8 Mandatory Transfers (29.7) (31.5) Mandatory Transfers - Comp & Sys Admin - Debt Svc (19.7) (16.6) Non-Mandatory Transfers 62.1 1.2 Nonmandatory Transfers - Comp & Sys Admin 141.9 28.6 Transfers From (To) Other State entities (2.7) (2.3) Transfers From (To) Other State entities (1.4) Change in Net Assets 126.2 68.7 Change in Net Assets 40.6 56.6 Net Assets, Beginning of the Year 635.1 566.4 Net Assets, Beginning of the Year 924.3 883.7 Net Assets, End of the Year 980.9 924.3 Net Assets, End of the Year 761.3 635.1 3
UTSA FY11 Sources of Revenue by Category Operating Sources by Category ($ in Millions) 4
UTSA FY11 Sources of Revenue Operating Sources ($ in Millions) 5
UTSA FY11 Uses of Funds Operating Uses ($ in Millions) 6
Reconciliation of Research Expenditures to AFR Operating Expenses - Research Reconciliation:FY11FY 10 Statement of Revenues, Expenses and 46,104,031 38,492,053 Changes in Net Assets- Research Expenses Facilities and Administration (F&A) 7,275,702 6,870,352 Capital Outlay 3,454,1283,289,557 56,833,861 48,651,962 *Total Research Expenditures * As Reported on THECB Research Expenditure Report 7
Expense Classification Summary • Salaries/Wages and other Payroll Related Costs • Professional Fees and Services • Communications • Repairs and Maintenance • Scholarships and Fellowships • Depreciation and Amortization • All Other Classifications • Total Operating Expenses 8
UTSA FY11 AFR Summary • UTSA continues to receive a “Satisfactory” rating from UT System as a result of a healthy financial condition. • UTSA’s operating margin ratio decreased from 3.7% for FY 2010 to 2.8% for 2011. The decrease in operating margin is attributable to growth in both total operating revenues of $20.2M and total operating expenses of $23.9M. 9