Download
1 / 69
720 likes | 858 Views
The Demand for Goods. Chapter 5. Determinants of Demand. What leads us to buy some goods while rejecting others?. The Sociopsychiatric Explanation. In Freud’s view, higher levels of consumption satisfy our basic drives for security, sex, and ego gratification.

E N D
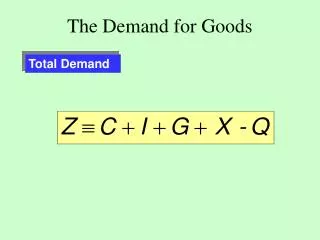
The Demand for Goods Chapter 5
Determinants of Demand • What leads us to buy some goods while rejecting others?
The Sociopsychiatric Explanation • In Freud’s view, higher levels of consumption satisfy our basic drives for security, sex, and ego gratification. • According to some sociologists, consuming more is an expression of identity that provokes recognition or social acceptance.
The Economic Explanation • In explaining consumer behavior, economists focus on the demand for goods and services. • Demand is the willingness and ability to buy specific quantities of a good at alternative prices in a given time period, ceteris paribus.
The Economic Explanation • An individual’s demand for a product is determined by: • Tastes—desire for this and other goods. • Income—of the consumer. • Expectations—for income, prices, tastes. • Other goods—their availability and prices.
The Demand Curve • Economists are interested in how consumer tastes affect consumption decisions.
Utility Theory • Utility is the pleasure or satisfaction obtained from a good or service. • The more pleasure a product gives us, the higher the price we’re willing to pay for it.
Total vs. Marginal Utility • Total utility is the amount of satisfaction obtained from entire consumption of a product.
Total vs. Marginal Utility • Marginal utility is the change in total utility obtained by consuming one additional (marginal) unit of a good or service.
TOTAL UTILITY MARGINAL UTILITY Negative marginal utility Total utility Total Utility Marginal Utility Rising total utility Diminishing marginal utility 0 1 2 3 4 5 6 0 1 2 3 4 5 6 Quantity of Popcorn (boxes per show) Quantity of Popcorn (boxes per show) Total vs. Marginal Utility
Diminishing Marginal Utility • According to the law of diminishing marginal utility, the marginal utility of a good declines as more of it is consumed in a given time period. • As long as marginal utility is positive, total utility must be increasing.
Diminishing Marginal Utility • According to the law of diminishing utility, each successive unit of a good consumed yields less additional utility. • Eventually, additional quantities of a good yield increasingly smaller increments of satisfaction.
TOTAL UTILITY MARGINAL UTILITY Negative marginal utility Total utility Total Utility Marginal Utility Rising total utility Diminishing marginal utility 0 1 2 3 4 5 6 0 1 2 3 4 5 6 Quantity of Popcorn (boxes per show) Quantity of Popcorn (boxes per show) Diminishing Marginal Utility
Price and Quantity • Tastes, through marginal utility, tells us how much we desire particular goods. • Price tell us how much of a good we will buy.
Price and Quantity • We make the ceteris paribus assumption when we look at the relationship between the price of the good and the amount we’re willing to buy. • Ceterisparibus - The assumption of nothing else changing.
Price and Quantity • The more marginal utility a product delivers, the more a consumer is willing to pay, ceteris paribus. • As the marginal utility of a good diminishes, so does our willingness to pay.
Price and Quantity • According to thelaw of demand, the quantity of a good demanded in a given time period increases as its price falls, ceteris paribus.
Price and Quantity • Thedemand curve describes the quantities of a good a consumer is willing and able to buy t alternative prices in a given time period,ceteris paribus. • The law of demand is illustrated by a downward-sloping demand curve.
$0.55 A 0.50 B 0.45 C 0.40 D 0.35 E 0.30 PRICE (per ounce) F 0.25 G 0.20 H 0.15 I 0.10 J 0.05 0 4 8 12 16 20 24 28 32 Quantity Demanded (Ounces per show) Individual’s Demand Schedule and Curve The willingness to pay diminishes along with marginal utility
Price Elasticity • The response of consumers to a change in price is measured by the price elasticity of demand.
Price Elasticity • Theprice elasticity of demand is the percentage change in quantity demanded divided by the percentage change in price.
Price Elasticity • The price elasticity of demand (E) is always negative because quantity demanded decreases when prices increase. • The absolute value of the price elasticity of demand will always be greater than zero.
Computing Price Elasticity • To ensure consistency, average quantity and average price (before and after) is used in the calculation.
Elastic vs. Inelastic Demand • If E is larger than 1, demand is elastic. • Consumer response is large relative to the change in price. • If E is less than 1, demand is called inelastic. • Consumers aren’t very responsive to price changes. • If E equals 1, demand is unitary elastic.
Extremes of Elasticity • A horizontal demand curve means that demand is perfectly elastic. • Any price increase would cause demand to fall to zero. • A vertical demand curve means that demand is completely inelastic. • Quantity demanded will not change regardless of the price change.
Completely elastic (E = ) Completely inelastic (E = 0) p2 p2 Price Price p1 p1 q1 q1 0 0 Quantity Quantity Extremes of Elasticity
Determinants of Elasticity • The price elasticity of demand is influenced by all of the determinants of demand. • Four factors are particularly worth noting: • Necessities vs. luxuries. • Availability of substitutes. • Relative price (to income). • Time.
Necessities vs. Luxuries • Demand for necessities is relatively inelastic • Necessities are goods that are critical to our everyday life,
Necessities vs. Luxuries • Demand for luxury goods is relatively elastic. • Luxuries are goods we would like to have but are not likely to buy unless our income jumps or the price declines sharply.
Availability of Substitutes • The greater the availability of substitutes, the higher the price elasticity of demand.
Relative Price (to income) • The higher the price in relation to a consumer’s income, the higher the elasticity of demand. • The price elasticity of demand declines as price moves down the demand curve.
Time • The long-run price elasticity of demand is higher than the short-run elasticity. • Consumers are better able to change their buying habits over the long-run that in the short-run.
Price Elasticity and Total Revenue • There is a relationship between price elasticity and total revenue. • Total revenue – The price of a product multiplied by the quantity sold in a given time period: p x q. Total revenue = Price X Quantity sold
Price Elasticity and Total Revenue • A price hike increases total revenue only if demand in inelastic (E < 1). • A price hike reduces total revenue if demand is elastic (E > 1). • A price hike does not change total revenue if demand is unitary elastic (E = 1).
Price Elasticity and Total Revenue $0.55 0.50 B 0.45 C Higher prices will reduce total revenue if E > 1 0.40 0.35 0.30 PRICE (per ounce) 0.25 0.20 0.15 0.10 0.05 0 2 4 6 8 10 12 14 16 18 20 22 24 26 28 30 32 QUANTITY DEMANDED (ounces per show)
Changing Value of E • Price elasticity changes along a demand curve. • The impact of a price change on total revenue depends on the (changing) price elasticity of demand.
The demand curve $8 7 Elastic E > 1 6 5 Unit elastic E = 1 PRICE 4 3 2 1 Inelastic E < 1 0 10 20 30 40 50 60 70 80 90 100 110 Total revenue E = 1 $225 200 175 150 Elastic E > 1 Inelastic E < 1 125 TOTAL REVENUE 100 75 50 25 0 10 20 30 40 50 60 70 80 90 100 110
Other Elasticities • Other factors affect consumption behavior.
Shifts vs. Movements • When the price changes, the outcome is a movement along the unchanged demand curve. • When the underlying determinants of demand change, the entire demand curve shifts.
Income Elasticity • An increase in consumer income will cause a rightward shift in demand. • Consumers will now purchase more at any price than they did prior to the increase in income.
Shift Income Elasticity F N 0.25 Price of Popcorn (dollars per ounce) D2 (after income rise) D1(before income rise) 0 12 16 Quantity of Popcorn (ounces per show)
Income Elasticity • Income elasticity of demand is the percentage change in quantity demanded divided by percentage change in income.
Computing Income Elasticity • As with price elasticity, income elasticity is computed using average values for the changes in quantity and income.
Normal vs. Inferior Goods • A normal good has an income elasticity of demand greater than zero. • Anormal good is a good for which demand rises when income rises.
Normal vs. Inferior Goods • An inferior good has an income elasticity of demand less than zero. • An inferior good is a good for which demand decreases when income rises.
Cross-Price Elasticity • A change in the price of one good affects the demand for another. • The decision to buy a good depends on the prices of substitutes and complements of that good.