Download
1 / 23
230 likes | 232 Views
National Park Service Inventory and Monitoring Program.

E N D
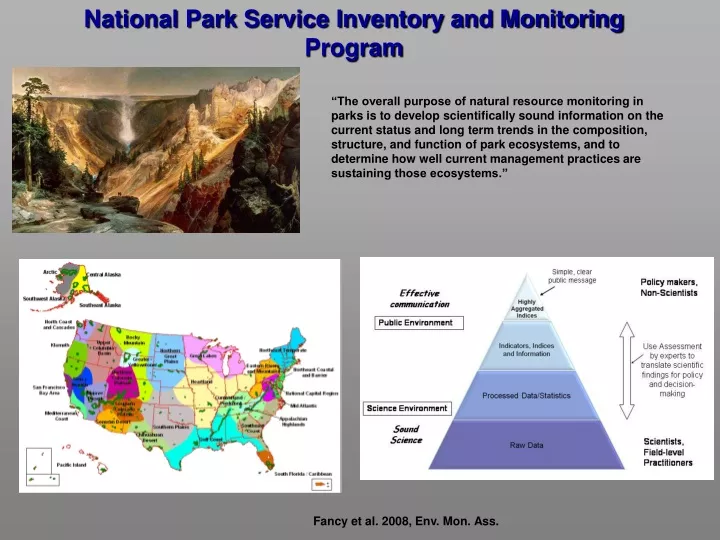
National Park Service Inventory and Monitoring Program “The overall purpose of natural resource monitoring in parks is to develop scientifically sound information on the current status and long term trends in the composition, structure, and function of park ecosystems, and to determine how well current management practices are sustaining those ecosystems.” Fancy et al. 2008, Env. Mon. Ass.
Ecological Conditions of US National Parks: Enabling Decision Support Through Monitoring, Analysis, and Forecasting NASA Applications Program: Decision Support through Earth-Sun Science Research Results Project NPS I&M Program Objectives • Identify NASA and other products useful to park monitoring and identify the boundaries of the greater park ecosystems appropriate for monitoring. • Add value to these data sets for understanding change through analysis and forecasting. • Deliver these products and a means to integrate them into the NPS I&M decision support framework.
Team and Approach John Gross NPS I&M Andy Hansen and Nate Piekielek Montana State University Cathy Jean, Rob Daily NPS I&M Yellowstone and Grand Teton Delaware Water Gap Yosemite Rocky Mountain Forrest Melton, Rama Nemani, NASA Aimes Linda Mutch, Bill Kuhn NPS I&M Dave Theobald Colorado State Univ Billy Schweiger, Brent Frakes NPS I&M Scott Goetz Woods Hole Matthew Marshall, NPS I&M
Objective 1: Indicators 1. Evaluate which TOPS and other products are most relevant to parks monitoring. 2. Select potential high priority indicators in context of NPS I&M conceptual models and I&M scientists. (24 identified) 3. Finalize indicators to demonstrate power of the approach (13 listed) Jones et al., 2008, RSE Nemani et al., 2003, EOM
Objective 1: Delineating Greater Ecosystems Hansen and Defries 2007, EA
Objective 1: Delineating Greater Ecosystems Greater Yellowstone Ecosystem
Objective 1: Delineating Greater Ecosystems Hansen, A., S. Running, C. Davis, J. Haas. Vulnerability of US National Parks to Climate and Land Use Change
Objective 2: Add Value Through Analysis and Forecasting Natural resource metrics Land use change metrics Output Analyses • Land cover • Extent • Spatial configuration • Land use • Home density and area impacted • Agriculture • Road density and area impacted • Development in Park • Animal species distribution/habitat use • Ecosystem/habitat extent • Biodiversity indices • Bird Hotspots • Corridors • High Priority Conservation Areas Habitat Suitability Models Connectivity Models Human Disturbance Models Future Land Use Models Habitat Extent/Spatial Configuration + Connectivity + Human Disturbance + Habitat Vulnerability to Future Land Use Integrated Habitat Condition + =
Objective 2: Add Value Through Analysis and Forecasting Hindcast Nowcast Forecast 1950 2005 2005 2050 TOPS (Gridded) Downscaled-GCMs (point based) Climate NPP/GPP TOPS (Gridded) Downscaled-GCMs (point based) TOPS (Gridded) Downscaled-GCMs (point based) Snow Phenology TOPS (Gridded) Downscaled-GCMs (point based) Disturbance SERGM SERGM Home density SLEUTH Impervious Visitorsheds Landscape spatial pattern Connectivity Biodiversity Altered by land use Altered by land use Data/Models Theme Data/Products Theme Data/Models
Objective 2: Add Value Through Analysis and Forecasting Input data Indicator Indicator Geography AH, NP Crucial habitat Biodiversity FM GPP/NPP Landfire Extent & proportion Of ecosystems Soil moisture TOPS climate, Snow MODIS Phenology GPE Disturbances SG Connectivity DT Housing density US Housing density DEWA SERGoM SLEUTH Impervious cover US Landsat Census of Ag, Ec. Impervious cover DEWA Land use SERGoM NLCD Stream biotic Visitorshed Travel time wts Roads Watersheds FLoWS
Objective 2: Add Value Through Analysis and Forecasting Anomaly Detection for Monitoring of Disturbance Effects and Vegetation Condition • For central Sierra Nevada, from 2000-2006: • An anomaly threshold of -6% detected >350,000 negative anomaly events after QA filtering • Detected 74% of fire events > 300 acres in size • 84% of FPAR anomalies explained through cross-referencing • Next step is to examine unexplained anomalies using time series of Landsat data to verify
Objective 2: Add Value Through Analysis and Forecasting SERGoM housing density: • 1940-2000, 10 • 2010-2030, 10 Revisions: • Dasymetric mapping • Groundwater wells (west) • NLCD2001 • Roads + slope • PAD v4.5plus
Objective 2: Add Value Through Analysis and Forecasting ICLUS SRES Housing Density Summary of Adjustments to SERGoM v3 for SRES scenarios
Objective 2: Add Value Through Analysis and Forecasting Great Smoky Mountain Park Delaware Scenic River Park Connectivity of Core Habitat Areas Graph Theoretic Approach Example Loss of Habitat Connectivity Associated with Exurban Growth Goetz et al, RSE
Objective 3: Integrate into NPS I&M Framework • Summaries - by spatial and temporal scale • Stories – interpretation of trends and interactions • Delivery – Standard Operating Procedures, Model Builder tools, contracts • Web-based interface – data organization, display, access
Objective 3: Integrate into NPS I&M Framework • Topographic Wetness Index+ (TWI+) • Computes the Topographic Wetness Index that incorporates solar insolation (TWI -- also known as Compound Topographic Index). This index is based on Beven and Kirkby's (1979) TOPMODEL, which is a physically based, distributed watershed model that simulates hydrologic flow of water, identifying where saturated land-surface areas develop that have the potential to produce overland flow. It is commonly used to general a surface of soil moisture and used for vegetation and hydrological modeling. • Rather assuming that all locations have the same amount of contributing moisture, this tool incorporates differences between south and north facing aspects. That is, rather than accumulating a value of 1.0 for all cells (as in TWI), this tool accumulates a weighted value ranging from 0.0 (xeric) to 1.0 (mesic) based on insolation. Here we use a simple approximation of solar insolation based on the HILLSHADE routine, using azimuth and altitude values that represent the location of the sun at the autumnal equinox at noon. • TWI = ln ( a / tan( b) ), where a is the accumulated upslope area and b is the local slope in degrees. • Beven, K.J. and M.J. Kirkby. 1979. A physically based variable contributing area model of basin hydrology. Hydrologic Science Bulletin 24(1):43-69. • Note: This tool is part of the LCaP toolbox. Theobald, D.M. 2007. LCaP v1.0: Landscape Connectivity and Pattern tools for ArcGIS. Colorado State University, Fort Collins, CO.
Objective 3: Integrate into NPS I&M Framework • Browser-based, open source (ka-Map / Mapserver) data access and visualization system • Rapid data access, visualization, query, and analysis • Supports timeseries plots, animations, data queries • FTP & WMS data access TOPS Data Gateway
Schedule 1. Identify NASA and other products useful to park monitoring and identify the boundaries of the greater park ecosystems appropriate for monitoring these indicators. Establish collaborative team Complete survey of NPS I&M network scientists Identify and prioritize indicators Quantify boundaries of greater park ecosystems Complete evaluation report 2. Add value to these data sets for understanding change through analysis and forecasting. Complete assessement report Develop and apply functional prototype models Develop SOPs Synthesize results into “stories” useful to managers 3. Deliver these products and a means to integrate them into the NPS I&M decision support framework. Develop Model Builder tools Finalize web-based delivery system Conduct training sessions Complete final report
Monitoring and forecasting of park ecosystem conditions in near real-time. • Rapid assessment and early warning of disturbance events. • Browser-based data access and visualization. Fire: ID356 TMax: 27 Tmin: 19 Windspd: 8.5 Wind Dir: NE NDVI: 0.6721 Objective 3: Integrate into NPS I&M Framework Ecocast Web Mapper