Download
1 / 17
170 likes | 305 Views
Quality Control of Station Assembly. Stations built so far. Prototype stations 1 – 4; had problems: Did not know which channel is the centre of the station Lots of problems on channel mapping Light loss due to hole mis-alignment at optical connectors

E N D
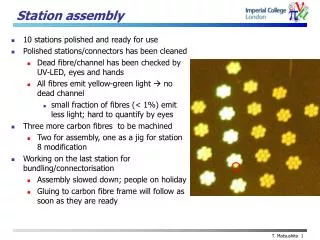
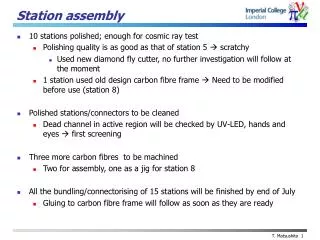
Stations built so far • Prototype stations 1 – 4; had problems: • Did not know which channel is the centre of the station • Lots of problems on channel mapping • Light loss due to hole mis-alignment at optical connectors • Fifth station – the first production version for trackers • Built with new procedure that incorporates quality control to rectify any errors occurred during manufacturing. Improvements: • Centre fibre clearly marked during ribbon production • Optical connector hole alignment checked • Number of bundles in a connector checked • Number of fibres in a bundle checked • Sequence of fibres checked • Should have rectified problems encountered for stations 1 – 4, yet to be confirmed
Station assembly overview • First doublet-layers are manufactured at FNAL • 350 mm diameter fibres are laid-out on a mold with groove pitch of 426 mm;1491 fibres used per doublet-layer • Then make bundles of seven fibres, put them through optical connectors, then layers stacked and glued • Quality Control before gluing them together Centre fibre
Bundling - i • Make bundle of seven fibres starting from the centre fibre • Seven fibres held together with rubber tube => single read-out channel • “comb” is used for bundling and QC procedure; bundles are stacked in grooves of the comb, channel map defined • bundles of four columns (5-6-5-6 or 5-6-5-4) for one connector
Connectorisation - i • A 22 way optical connector mates seven scintillating fibres with one clear fibre waveguide; • alignment of connector holes at scintillating fibres and clear fibres sides are checked with ‘go/no-go gauge’ • The scintillating fibre bundles are threaded through one of 22 holes of optical connector • Connectorisation mapping for view X
Connectorisation - ii Fibre radius guide is used for connectorisation “Bridge” a tool for QC Bridge with connectors in place
QC - setup • Bundling/Connectorisation most labour intensive, source of errors • We perform QC step after bundling/connectorisation with the setup shown LED (20 mW, l = 405nm) / optics CCD Translation stage Doublet layer
QC– counting - i • First number of bundles for a connector as well as number of fibres in a bundle are checked after bundling and connectorisation • CCD images of one connector worth of bundles are taken Fibre bundles in comb Fibre bundles in connector
QC – counting - ii • Then software identifies bundles and fibres in the CCD image taken • Notifies operator if there are any failures • Twenty two bundles identified for comb/connector • Seven fibres in a bundle identified with different colours Analysed comb image Analysed connector image
QC – scanning - i • If counting QC was OK, move on to fibre sequence check by LED scanning • Scan fibre plane with UV LED at 1250 micron/seconds • Capture image at 24.98 frames/seconds => 50 micron/frame [movie] • Trace sum of CCD intensity for 9 pixels around fibre centre • Bottom fibre signal distortedby the top fibres and glue UV LED Top fibres Bottom fibres
QC – scanning - ii “peak” • Find frame # of intensity “peak” of each fibre; • Frame # of leading edge = maximum intensity * 0.5 • Frame # of trailing edge = maximum intensity * 0.5 • Frame # of ‘peak’ = (leading edge + trailing edge)*0.5 • Plot frame # of intensity ‘peak’ of each fibre; • As frame # increases bundle # (channel number) increases, no overlaps of X • Fibre sequence as well as bundle order should be OK before gluing a ribbon Max. Each Xcorresponds to ‘peak’ Seven X in each bundle
QC – scanning - iii • Samples of errors identified during assembly Fibre swap between bundles 17&18 and 19&20 Wrong bundle order
QC – scanning - iv • Time interval of each ‘peak’ checked as well • Negative interval if there is fibre swap between bundles • mean = 4.24 frames => 212.17 micronagrees with measured mold pitch of 426/2 micron
Point of no return - gluing • Fix vacuum chuck, carbon-fibre station frame to gluing jig • Then glue them together
Potting & polishing • Pot fibres to connectors, then apply glue to stiffen fibres then cut and polish Apply glue Cut fibres After polishing
Summary • New station assembly procedure with QC process incorporated worked out to overcome problems seen in prototype stations • Station 5 built with new manufacturing procedure, which proven to work • 4473 350 micron fibres successfully bundled and connectorised by hand • Ready for test with read-out • Station assembly is underway with the new assembly procedure