Download
1 / 22
230 likes | 333 Views
Biogeography & Biodiversity. Chapter 24. Ecosystems & Climate . Biogeography - study of distributions of organisms The shift from travel notes to surveys to measurements Vegetation structure to climatic conditions Using community structure for inferring climate The switch to using both

E N D
Biogeography & Biodiversity Chapter 24
Ecosystems & Climate Biogeography- study of distributions of organisms The shift from travel notes to surveys to measurements Vegetation structure to climatic conditions Using community structure for inferring climate The switch to using both Units of plant and animal life = Biomes
Ecosystems & Climate • Classification of plant types • Candolle (1855) • Divided world into zones based on plant types • Distribution along altitudinal gradient • Merriam (1884)
Ecosystems & Climate • Study of animal life distribution followed • F.E. Clements & V.E. Shelford (1939) • Combined plant / animal distribution • Community concept • Introduced biotic unit of Biome • Biogeography
Ecosystems & Climate Classification of climate Koppen (1900) Used Candolle’s plant classification Established link between climate and plant distribution
Classification themes • Reflect adaptations of the dominant plant forms to regional climate • Abundance of trees, shrubs, and grasses • Leaf types • Relative allocations of carbon above and below ground • Adaptations to moisture, temperature, nutrients
Evidence of adaptations • Similar climates producing similar plant forms • Despite evolutionary relatedness of taxa • Covergent evolution • Charles Darwin • Similarities in form & function
Terrestrial ecosystems • Classification based on plant forms • Patterns of geographic scale • Most prevalent – equatorial diversity • Diversity highest where productivity is highest • Tropical production / diversity • Altitudinal variation
Terrestrial ecosystems Variations in distribution
Evapotranspiration gradient AET (actual)
Evapotranspiration gradient PET (potential)
Ecosystem biomass • Temperature / rainfall • Evapotranspiration rate • Decomposition rate • Nutrient cycling • Biomass allocation • trees / shrubs / grasses • Complex physical structure biodiversity Major biomes
Ecosystem biomass Standing biomass – function of temperature & precipitation
Aquatic ecosystems • Linked by water cycle • Classified by physical features • Salt content • Freshwater • Marine • Estuarine • Flow • Lentic • Lotic • Depth profile • Light penetration • Temperature • Dissolved oxygen • Productivity
Aquatic ecosystems • Diversity highest equator • Diversity/productivity inversely related • Seasonality • Vertical movement of nutrients • Marine systems • Upwellings determine productivity • Permanent equatorial thermocline • supports higher diversity
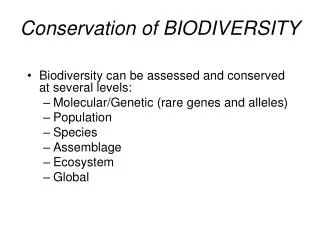
Diversity Alpha diversity – local community Gammadiversity – within a geographical area (across communities) • Gamma diversity changes occur over geological time • Alpha diversity may change with local habitat disturbance
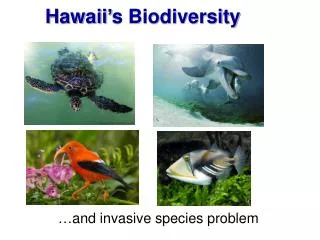
Habitat destruction • Leading cause of species loss • Vegetative losses • Patch habitat • Global tropical rainforest loss • 2.4 acres / second (2 football fields) • 149 acres / minute • 214,000 acres / day (larger than New York City) • 78 million acres / year (larger than Poland) • 137 species becomes extinct every day (50,000 / year)
Terrestrial ecosystems revisited • Terrestrial ecosystem classification– vegetative biomass production • Vegetative heterogeneity increases species diversity • Increased production increased diversity • Diversity generally highest at equator
Aquatic ecosystem revisited • Aquatic ecosystem classification – physical features • Seasonality – productivity • Increased production decreased diversity • Marine vs. freshwater • Diversity generally highest at equator
Edge habitats • Edge habitats increase diversity • Marine coastal habitats • Estuaries, bays, lagoons • Tidal influences • Salinity influences • Temperature variations • Terrestrial edge habitats • Increased vertical stratification • Increased species habitat