Download
1 / 51
510 likes | 517 Views
Rain began at 11 p.m. with approximately 0.10" falling. Señor Perfect Forecast with 84.7% accuracy. Forecast verification time!

E N D
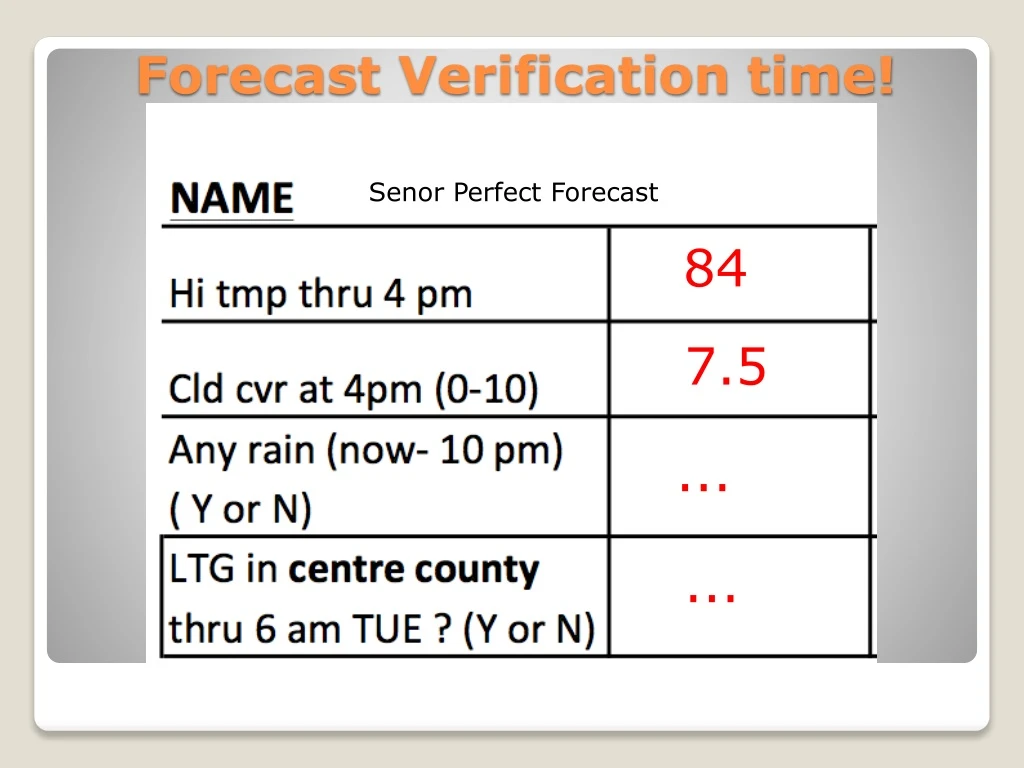
Senor Perfect Forecast 84 7.5 ... ... Forecast Verification time!
Senor Perfect Forecast 84 7.5 No .. No .. Forecast Verification time!
DAY 1 DAY 1
MON 18z = ? 2 p.m. GFS MODEL LIFTED INDEX LIFTED INDEX = measure of how unstable atmosphere is between sfc and 500mb
Heating … Heating … Heating (heavy diversion advisory) Buoyancy = Tendency for air to accelerate away from it’s position Convection = Transfer of heat via air movement Radiative heating via El Sol • Synonym for: • Atmospheric instability • Convective instability • Unstable atmosphere • Convectively unstable • atmosphere Conduction = Transfer of heat via DIRECT contact
Lifted Index (LI)=-5 Li=? Convection 500mb -10C -5C
Lifted Index (LI)=0 Li=? Convection 500mb -5C -5C
Lifted Index (LI)=+5 Li=? Convection 500mb -0C -5C
00z TUE = 8 p.m. MON 06z TUE = 2 a.m. TUE
De donde son ustedes? (Where are you from) Most interesting weather at your hometown?
Warm Sector vs. Cool Sector Air Masses …. Large Volume of air with similar T and Q characteristics (Maritime Tropical, Continental Tropical Maritime Polar, Continental Polar)
Air Masses …. Large volume of air with similar T and H characteristics Maritime Tropical Continental Tropical Maritime Polar Continental Polar LocationSummer Winter 90 ... 75 | 75 ... 65 ….. Florida …. …. Arizona …. 105 … 35 | 70 ... 15 … Coastal AK, BC, Pac NW .. 65 … 55 | 38 ... 35 …. Central Canada … 77 … 48 | 15 … -15
L 500 MB MODEL FORECAST (UPPER LEVELS) Monday L X H Wind flow nearly parallel to isobars in upper levels = minimal friction
500 MB MODEL FORECAST (UPPER LEVELS) Today L X H
700 MB MODEL FORECAST (Mid Levels of troposphere) This Evening
4 panel map – GFS forecast – Valid Tomorrow (WED) evening 500 mb SFC prs Precip (12 hrs) 700 mb
Penn State Weather Camps Basic Weather Forecasting Guidelines • Sat I – Sat II – Sat III- NWS – NHC - SPC - Radar - Radar - Radar • sfc. map 1 - sfc. map 2 - EWALL - Soundings
Frank Weather-Climo ~ 73 5 5 YES
CLIMATOLOGY 30 year period - common NORMAL? 81 TEMPS Avg./mean: Conforming to a regular pattern; typical Median: Range: 82 90 - 68 7 Std. dev. 60’s = 70’s = 80’s = 90’s = 2 8 18 2 0.15” 0-1.79” 43% RAIN Avg./Mean: Range: % time:
WHAT IS CLIMATOLOGY ? How the weather behaves over a long period of time. Weather – Behavior of the atmospheric over a much shorter period of time
Climatology Forecast Key West Boston CLI 88 77 6/168872 6/17 86 75 6/18 86 70 6/19 88 71 6/20 88 73 6/21 89 76 6/22 89 83 6/23 88 87 AVG ERR. 0.755.1 BIAS 0.25 1.1
Surface Observations YYZ = Station 63 = 54 = 105 = Temp Dewpoint SL Pressure Sky cover Station = Temp = Dewpoint = Pressure = PIT 65 58 1011.2mb SE 5 kts
Surface Weather Map + Other nifty analyses
L H H
...Ohio Valley/Southern and Central Appalachians... An upper-level trough will move eastward across the Mississippi Valley today as southwest mid-level flow remains over east-central U.S. At the surface, a cold front will advance eastward into the Ohio and Tennessee Valleys as a corridor of maximized low-level moisture sets up ahead of the front. Surface dewpoints in the upper 60s F should result in moderate instability by midday across much of the moist sector. As surface temperatures warm and low-level convergence increases along the front, scattered convection is forecast to initiate along and ahead of the front.
...Ohio Valley/Southern and Central Appalachians... Linear MCS development will be possible as storms increase in coverage and move northeast across the moist sector during the afternoon. RAP forecast soundings ahead of the front by 21Z from northern Kentucky southward into the southern Appalachian Mountains show MLCAPE values from 1000 to 2000 J/kg with steep low-level lapse rates. This along about 30 kt of 0-6 km shear should be favorable for isolated damaging wind gusts. Hail will also be possible with the stronger cells embedded in the any line that becomes established.
Frank Weather-Climo 81 5 NO NO
Penn State Weather Camps Basic Weather Forecasting Guidelines • Sat I – Sat II – Sat III- NWS – NHC - SPC - Radar - Radar - Radar • sfc. map 1 - sfc. map 2 - EWALL
GFS MODEL MON EVE NAM MODEL LIFTED INDEX LI = LIFTED INDEX = measure of how unstable The atmosphere is between sfc and 500mb Precipitable Water = If we “wrung” out all the moisture in the atmosphere, how much precip would we get
Buoyancy = Tendency for air to Accelerate Convection Conduction
Lifted Index (LI)=-5 Li=? Convection 500mb -10C -5C
Lifted Index (LI)=0 Li=? Convection 500mb -5C -5C
Lifted Index (LI)=+5 Li=? Convection 500mb -0C -5C
WHAT IS PERSISTENCE ? ASSUMES NO CHANGE ! WHAT HAPPENED … WILL CONTINUE TO HAPPEN