Download
1 / 4
40 likes | 43 Views
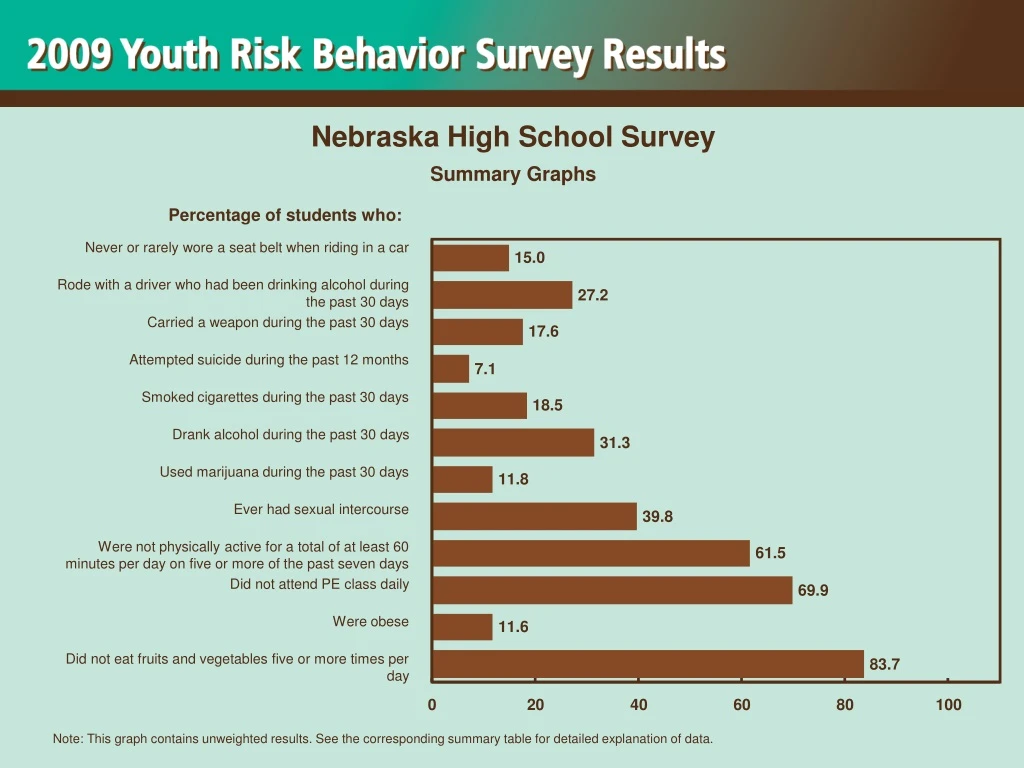
This summary graph highlights the percentage of students in Nebraska high schools who engage in risky behaviors such as not wearing seat belts, riding with drivers who have been drinking, carrying weapons, and attempting suicide. It also shows the percentage of students who engage in healthy habits such as regular physical activity, attending PE class, and eating fruits and vegetables. The data is presented for students who never or rarely engage in these behaviors and for students who sometimes, most of the time, or always engage in these behaviors.

E N D
Nebraska High School Survey Summary Graphs Percentage of students who: Never or rarely wore a seat belt when riding in a car 15.0 Rode with a driver who had been drinking alcohol during the past 30 days 27.2 Carried a weapon during the past 30 days 17.6 Attempted suicide during the past 12 months 7.1 Smoked cigarettes during the past 30 days 18.5 Drank alcohol during the past 30 days 31.3 Used marijuana during the past 30 days 11.8 Ever had sexual intercourse 39.8 Were not physically active for a total of at least 60 minutes per day on five or more of the past seven days 61.5 Did not attend PE class daily 69.9 Were obese 11.6 Did not eat fruits and vegetables five or more times per day 83.7 0 20 40 60 80 100 Note: This graph contains unweighted results. See the corresponding summary table for detailed explanation of data.
Nebraska High School Survey Summary Graphs Percentage of students who: Sometimes, most of the time, or always wore a seat belt when riding in a car 85.0 Did not ride with a driver who had been drinking alcohol during the past 30 days 72.8 Did not carry a weapon during the past 30 days 82.4 Did not attempt suicide during the past 12 months 92.9 Did not smoke cigarettes during the past 30 days 81.5 Did not drink alcohol during the past 30 days 68.7 Did not use marijuana during the past 30 days 88.2 Never had sexual intercourse 60.2 Were physically active for a total of at least 60 minutes per day on five or more of the past seven days 38.5 Attended PE class daily 30.1 Were not obese 88.4 Ate fruits and vegetables five or more times per day 16.3 0 20 40 60 80 100 Note: This graph contains unweighted results. See the corresponding summary table for detailed explanation of data.
Nebraska High School Survey Summary Graphs Number of students in a class of 30 who: Never or rarely wore a seat belt when riding in a car 4.5 Rode with a driver who had been drinking alcohol during the past 30 days 8.2 Carried a weapon during the past 30 days 5.3 Attempted suicide during the past 12 months 2.1 Smoked cigarettes during the past 30 days 5.6 Drank alcohol during the past 30 days 9.4 Used marijuana during the past 30 days 3.5 Ever had sexual intercourse 11.9 Were not physically active for a total of at least 60 minutes per day on five or more of the past seven days 18.5 Did not attend PE class daily 21.0 Were obese 3.5 Did not eat fruits and vegetables five or more times per day 25.1 0 10 20 30 Note: This graph contains unweighted results. See the corresponding summary table for detailed explanation of data.
Nebraska High School Survey Summary Graphs Number of students in a class of 30 who: Sometimes, most of the time, or always wore a seat belt when riding in a car 25.5 Did not ride with a driver who had been drinking alcohol during the past 30 days 21.8 Did not carry a weapon during the past 30 days 24.7 Did not attempt suicide during the past 12 months 27.9 Did not smoke cigarettes during the past 30 days 24.5 Did not drink alcohol during the past 30 days 20.6 Did not use marijuana during the past 30 days 26.5 Never had sexual intercourse 18.1 Were physically active for a total of at least 60 minutes per day on five or more of the past seven days 11.6 Attended PE class daily 9.0 Were not obese 26.5 Ate fruits and vegetables five or more times per day 4.9 0 10 20 30 Note: This graph contains unweighted results. See the corresponding summary table for detailed explanation of data.