Download
1 / 27
300 likes | 496 Views
Synoptic & Mesoscale Fronts. Synoptic & Mesoscale Fronts. Fronts and Jet Streaks: The Basics Common Structure on the Mesoscale Coupling with Jet Streaks Mesoscale Fronts Dry Line Gust Fronts Sea-Breeze Fronts Coastal Fronts Topographically Induced Fronts . Frontal Structure.

E N D
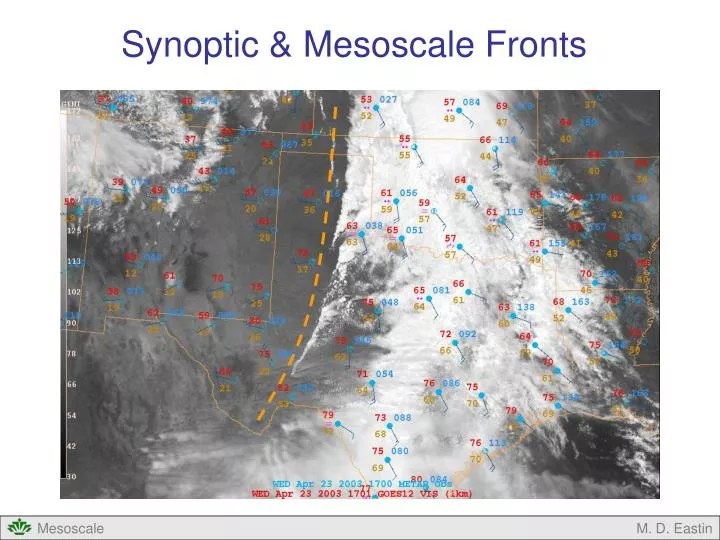
Synoptic & Mesoscale Fronts M. D. Eastin
Synoptic & Mesoscale Fronts • Fronts and Jet Streaks: The Basics • Common Structure on the Mesoscale • Coupling with Jet Streaks • Mesoscale Fronts • Dry Line • Gust Fronts • Sea-Breeze Fronts • Coastal Fronts • Topographically Induced Fronts M. D. Eastin
Frontal Structure • Fronts: • Pronounced slopingtransition zones in the temperature, moisture, and wind fields • Contain large vorticity gradients and vertical wind shears • Cross front scale (10-100 km) is often an order of magnitude smaller than along front scale (100-1000 km) • Shallow (1-5 km in depth) • Most often observed near the surface, but also occur aloft near the tropopause • Important for mesoscale weather: • Rapid local changes in weather • Associated with clouds and precipitation • Often provide the necessary “trigger” for initiating deep convection Cold Warm M. D. Eastin
Frontal Structure Examples: Cold Front Occluded Front Warm Front Forward-tilting Cold Front Note: Contours are of potential temperature M. D. Eastin
Frontal Structure Cross-Section: M. D. Eastin
Coupling with Jet Streaks • Divergence and vertical motion patterns associated with upper-level Jet Streaks • Using a simplified vorticity equation: • Vorticity Divergence • Change • Thus, the vorticity change experienced by • an air parcel moving through the jet streak • will lead to: • Vorticity decrease → Divergence aloft • → Upward motion • Vorticity increase → Convergence aloft • → Downward motion Vort Max Left Exit Left Entrance + Vorticity Increase Vorticity Decrease JET _ Vorticity Decrease Vorticity Increase Right Exit Right Entrance Vort Min Left Entrance Left Exit Descent Ascent JET Ascent Descent Right Exit Right Entrance M. D. Eastin
Coupling with Jet Streaks • The orientation of a surface front and an upper-level jet streak can lead to either • enhanced (deep) convection or suppressed (shallow) convection along the front • Enhanced Convection → Left exit or right entrance region is above the front • → Helps destabilize the potentially unstable low-level air • → Increases the likelihood of deep convection M. D. Eastin
Coupling with Jet Streaks • The orientation of a surface front and an upper-level jet streak can lead to either • enhanced (deep) convection or suppressed (shallow) convection along the front • Suppressed Convection→ Left entrance or right exit region is above the front • → Prevents destabilization of the potentially unstable air • → Decreases the likelihood of deep convection M. D. Eastin
The Dryline • Common Characteristics and Structure: • Can be defined as a near surface convergence zone between moist air flowing off the Gulf of Mexico and dry air flowing off the semi-arid, high plateaus of Mexico and the southwest United States • Observed from southern Great Plains to the Dakotas → east of the Rockies • Occur between April and June when a surface high is located to the east and • westerly flow aloft and a weak lee-side surface low is located to the west • The 55°F isodrosotherm or the • 9.0 g/kg isohume are often used • to indicate dryline position • Dewpoint gradient often 15°F • per 100 km or larger • Wind shift and moisture gradient • are not always collocated • Note: Drylines also occur in • India, China, and • west Africa M. D. Eastin
The Dryline • Common Characteristics and Structure: • Large diurnal variations • Morning → Shallow (below ~850 mb) • → Furthest westward extension • → Moist layer capped by strong nocturnal temperature inversion • Evening → Deeper (up to 750 mb) • → Furthest eastward extension • → Dry mixed-layer on west side often extends up to 500 mb Morning (6 am LST) Late Afternoon (6 pm LST) West-East Cross Sections Extend from Tuscon, AZ to Shreveport, LA Solid Lines are potential temperature (θin K) Dashed Lines are mixing ratio (w in g/kg) Capping Inversion Capping Inversion Dry Dry Moist Moist M. D. Eastin
The Dryline • Significance: • Convection is frequently initiated along the dryline • Often develops into severe thunderstorms, producing strong winds, hail, and tornadoes • Over 90% of such convection • develops within 100 km • of the line on the moist side • Has important implications • for agriculture • Occur during the peak • of growing season • Hot / Dry to the west • (need to irrigate more) • Warm / Humid east M. D. Eastin
The Dryline • Evolution and Movement: • Daytime – Eastward Motion: • Moves rapidly via sudden “leaps” (after sunrise) • Motion is much faster than would occur from advection alone…How? • Turbulent mixing induced • by solar heating begins • to erode the shallow west • side of the dry line Initial dryline position just prior to sunrise Thermals mix out shallow moist layer Dry line position moves east Capping Inversion T0 T1 New dryline position M. D. Eastin
The Dryline • Evolution and Movement: • Daytime – Eastward Motion: • Moves rapidly via sudden “leaps” (after sunrise) • Motion is much faster than would occur from advection alone…How? • Process continues • throughout the day • (T0 → T4) • In the late afternoon to • early evening the dryline • begins to move back • westward…Why? Deeper thermals continue to mix out shallow moist layer on west edge Capping Inversion T0 T1 T2 T3 Dryline positions T4 M. D. Eastin
The Dryline • Evolution and Movement: • Night time – Westward Motion: • During the day, a heat low develops west of the dryline, driving low level air toward the line • When the sun sets, radiational cooling weakens the westerly flow (dry, cloud free) much quicker than it weakens the easterly flow (moist, cloudy) • Dryline surges westward Schematic of Diurnal Evolution Noon 6 pm Midnight 6 am From Parsons et al. (2000) M. D. Eastin
The Dryline • Interaction with Synoptic Fronts: • Synoptic-scale cold fronts often “catch” and “interact” with dry lines • The point of intersection is called the triple-point • Location of enhanced convection • Front provides an additional source of lift • Front now has access to moist air • Severe thunderstorms often occur near the triple point on the warm moist side, Triple Point Severe Storms Ordinary Frontal Convection From Bluestein (1993) M. D. Eastin
The Dryline • Dryline Bulges: • Eastward “bulges” occasionally develop • during the afternoon hours • 80-100 km in scale • Preferred location for convective initiation due • enhanced convergence • Occur when mid-tropospheric winds are strong • Result from the deep turbulent mixing west • of the dryline transporting strong westerly winds • from aloft down toward the surface Example of a Dryline Bulge Schematic of Downward Transport M. D. Eastin
The Dryline Numerical Simulation Examples: Cross Section animation Plan View animation Courtesy of Ming Xue at the University of Oklahoma M. D. Eastin
Gust Fronts • Basic Characteristics and Structure: • Generated within thunderstorms by either • precipitation loading or evaporative cooling • at mid-tropospheric levels • Negative buoyancy brings cool air down to • the surface, where it spreads out, creating • outflow boundaries → gust fronts • Horizontal scale → 10 to 50 km • Vertical scale → 1 to 2 km • Time scale → 1 to 6 hours • Forward motion → 5 to 20 m/s • Often responsible for generating new • convection due to the enhanced • convergence and ascent along their • leading edge • Under special conditions can help maintain • intense long-lived squall lines…more on • this in the future From Wakimoto (1982) M. D. Eastin
Gust Fronts Three – Dimensional Structure: M. D. Eastin
Gust Fronts • Air Motions within a Gust Front: • Air parcel trajectories (labeled A → G) in a mature gust front G Initial Locations D B A From Droegemeier and Wilhelmson (1987) M. D. Eastin
Gust Fronts • Sequence of Surface Events during Mature Gust Front Passage: • Change in wind speed and direction • Direction may rotate 180° • Speed initially decreases • prior to frontal passage • and then rapidly increases • soon after frontal passage • Decrease in temperature on the • order of 2° to 5°C • Increase in pressure (~1 mb) • Initial rise is non-hydrostatic, • a dynamic effect created by • the collisions of two fluids • Second rise is hydrostatic, • the thermodynamic effect • from the cold air • Onset of light precipitation M. D. Eastin
Sea-Breeze Fronts • Basic Characteristics and Structure: • Result from differential surface heating/cooling along coasts on “light wind” days • Day → Heating over land (positively buoyant air rises) • → Onshore flow near surface – offshore flow aloft • Night → Cooling over land (negatively buoyant air sinks) • → Offshore flow near surface – onshore flow aloft • Front develops where onshore flow collides with “background” synoptic flow M. D. Eastin
Coastal Fronts • Basic Characteristics and Structure: • Stationary boundary separating relatively • warm moist air flowing off the ocean from • relatively cold dry air flowing off the continent • Occur in the late fall and early winter • from New England to Texas • Often form during cold air outbreaks • and cold-air damming events • Boundary between rain and freezing rain/snow • Temperature gradients of 5°-10°C over 5-10 km • Convergence zone enhanced by land-sea • friction contrasts M. D. Eastin
Topographically Induced Fronts • Denver Convergence Zone: • Generated by synoptic-scale easterly flow converging with shallow cold air flowing down topography (ridges and mountains) • Cold air originates in the nocturnal • boundary layer at high elevations • Air begins to flow down the slopes • and valleys • Converges with synoptic-scale • easterly flow by mid-morning • and begins to push eastward • onto the Great Plains • Usually dissipates by mid-afternoon • due to solar heating and surface • fluxes warming the shallow cold air Cheyenne Ridge Palmer Divide M. D. Eastin
Topographically Induced Fronts • Denver Convergence Zone: • Convergence line can help initiate deep convection → non-supercell tornadoes often form during such events • The topography in the Denver area often • leads to the development of a cyclonic • circulation → enhances convergence • Other Topographic Fronts: • Such circulations occur near most mountain • ranges, including the Appalachians, when • synoptic flow is weak and toward the range Denver Convergence Zone From Wilson et al. (1992) M. D. Eastin
Synoptic & Mesoscale Fronts • Summary • Frontal Structure on the Mesoscale • Coupling between Fronts and Jet Streaks • Vertical motion pattern • Impact on convection • Dry Lines (structure, significance, evolution, bulges) • Gust Fronts (basic characteristics, structure, air flow patterns) • Sea-Breeze Fronts (structure, physical processes) • Coastal Fronts (structure and physical processes) • Topographic Fronts (structure and physical processes) M. D. Eastin
References Bluestein, H. B, 1993: Synoptic-Dynamic Meteorology in Midlatitudes. Volume II: Observations and Theory of Weather Systems. Oxford University Press, New York, 594 pp. Bosart, L. F., 1985: New England coastal frontogenesis. Quart. J. Roy. Meteor. Soc., 101, 957-978. Droegemeier, K. K., and R. B. Wilhelmson, 1985: Three-dimensional numerical modeling of convection produced by interacting thunderstorm outflows. Part I: Control simulation and low level moisture variations. J. Atmos. Sci., 42, 2381–2403. McCarthy, J., and S. E. Koch, 1982: The evolution of an Oklahoma dryline. Part I: A meso- and sub-synoptic scale analysis. J. Atmos. Sci., 39, 225-236. Nielsen, J. W., 1989; The formation of New England coastal fronts. Mon. Wea. Rev., 117, 1380–1401. Parsons, D.B., M.A. Shapiro*, and E. Miller, 2000: The mesoscale structure of a nocturnal dryline and of a frontal-dryline merger. Mon. Wea. Rev., 128 ,11, 3824-3838. Schaefer, J. T., 1974: The lifecycle of the dryline. J. Appl. Meteor., 13, 444-449. Schaefer, J. T., 1986: The Dry Line. Mesoscale Meteorology and Forecasting, Ed: Peter S. Ray, American Meteorological Society, Boston, 331-358. Wakimoto, R. M., 1982: The life cycle of thunderstorm gust fronts as viewed with Doppler radar and rawinsonde data. Mon. Wea. Rev., 110, 1060–1082. Wilson, J. W., G. B. Foote, N. A. Crook, J. C. Frankhauser, C. G. Wade, J. D. Tuttle, and C. K. Mueller, 1992: The role of boundary-layer convergence zones and horizontal roles in the initiation of thunderstorms: A case study. Mon. Wea. Rev., 120, 1785-1815. Wilson, J. W., and W. E. Schreiber, 1986: Initiation of convective storms at radar observed boundary-layer convergence lines. Mon. Wea. Rev., 114, 2516–2536. M. D. Eastin