Download
1 / 48
480 likes | 486 Views
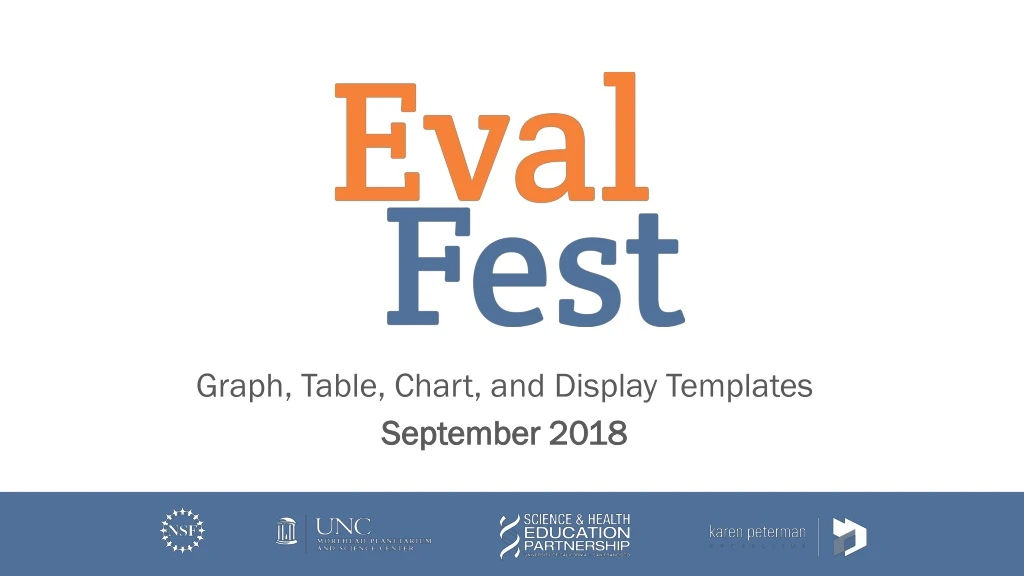
Graph, Table, Chart, and Display Templates September 2018. How to use these Eval Fest chart, table, and display templates. The following templates have been provided to enable our community to quickly develop on-brand charts, tables, and other visual displays.

E N D
Graph, Table, Chart, and Display Templates September 2018
How to use these Eval Fest chart, table, and display templates. • The following templates have been provided to enable our community to quickly develop on-brand charts, tables, and other visual displays. • As you consider what chart to adapt with your data, think about: • Your audience: what will communicate effectively to them? • Your data: what is the story you want to communicate? • Precision: how precise does the visual form need to be? Lines and bars are very precise, while bubbles, pies, and the saturation of hues are less precise. • Product: where will the chart be used? Sometimes when choosing between charts, selecting one to add visual interest and diversity is a driver in the decision process. • All templates have editable data embedded in the Powerpoint deck, and can be used as a starting point – adapt to your own needs!
Notes for reuse and adaptation of this template deck • The templates in this deck were tailored to the types of data stories often told with EvalFest evaluation data. All possible chart types are not represented here. • The deck may be adapted for new purposes, but should give credit to EvalFest and the contributing organizations. • An appropriate citation for adaptation of this template deck would be: • “Adapted from the EvalFest Graph, Table, Chart, and Display Templates (September 2018), supported by the National Science Foundation, UNC Morehead Planetarium and Science Center, Science & Health Education Partnership, and Karen Peterman Consulting, with design expertise from Excella Consulting.” • Adaptation and use of the chart templates for EvalFest reporting and dissemination purposes does not require any attribution.
81% I need to represent a percent of a total for a single measure. of returning attendees extended their experience by looking for more information or doing another activity related to a Festival topic 81% Clockwise, from top left: big number, 100% stacked bar, bar chart, icon matrix, donut chart, waffle chart
81% of returning attendees extended their experience by looking for more information or doing another activity related to a Festival topic
Extended their experience % of total attendees
81% 81% You may be familiar with a icon array of circles used for a similar purpose as these waffle charts. In this template deck, waffle charts are presented as an easier-to-read alternative. See notes for additional details on why.
I need to compare results from multiple measures. Learned something new Follow up activity Posted on social media 81% 64% 22% Clockwise, from top left: 100% stacked bar, bar chart, laylollipop chart, clustered waffle chart
Learned something new Follow up activity Posted on social media 81% 64% 22% Learned something new Follow up activity Posted on social media 81% 64% 22%
I need to compare groups across multiple measures or responses. Ratings & Outcomes for FemalesandMales HSAA BA/BS Post Grad Clockwise, from top left: dot plot, dumbbell plot (remove bars for dot plot), paired bar chart, small multiples chart, 100% stacked bar chart
Ratings for FemalesandMales Fun***
Ratings & Outcomes for MalesandFemales Event Rating Learning Inspired Awareness Careers
Ratings & Outcomes for MalesandFemales Event Rating Learning Inspired Awareness Careers
HSAA BA/BS Post Grad
HSAA BA/BS Post Grad
I need to display change over time. Clockwise, from top left: line chart, area chart, slope graph, column chart, dumbbell plot, multi-series line chart
I need to compare progress against a benchmark or comparison group. Clockwise, from top left: overlapped bar chart, single category bullet chart, multi-year bullet chart
Other Events: Never attended,All other groups I need to an easy to read data table comparing multiple metrics and periods. Superscripts indicate different levels of statistical significance
Other Events: Never attended,All other groups Superscripts indicate different levels of statistical significance