Download
1 / 9
90 likes | 180 Views
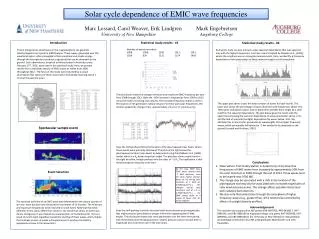
Variable Sun-Earth energy coupling: dependence on solar cycle strength. M. Yamauchi. Swedish Institute of Space Physics, Kiruna (M.Yamauchi@irf.se). Acknowledgements : Kp is an official IAGA endorsed index that is provided by GFZ, Adolf-Schmidt-Observatory Niemegk, Germany, through

E N D
Variable Sun-Earth energy coupling: dependence on solar cycle strength M. Yamauchi Swedish Institute of Space Physics, Kiruna (M.Yamauchi@irf.se) Acknowledgements: Kp is an official IAGA endorsed index that is provided by GFZ, Adolf-Schmidt-Observatory Niemegk, Germany, through ftp://ftp.gfz-potsdam.de/pub/home/obs/kp-ap/ The sunspot numbers are provided by the Royal Observatory of Belgium, Brussels, through http://sidc.oma.be/index.php3 B1066@ST5.1 (EGU2014-3864) Wednesday2014-04-30 1
Extremely low solar activity since last solar minimun Effect on the Earth? (SCOSTEP VarSITI program) Kiruna (65° GMLat) K index during the current maximum #24 (2011~) is nearly the same as values at solar minimums. note: 21-24 UT means 22-01 LT, and magnetic midnight sector when aurora activity causes large K. 2
Monthly Sunspot number (SSN) – Kp relation Low Kp for the same SSN since 2004 3
SSN – Kp (subdivided by different phases) Min Incl. Max Decl. 1. Each solar cycle must be subdivided by different phases (because the solar wind condition is different for the same SSN) 2. Kp since 2004 are the lowest for the same SSN 4
Reconstruct Kp from SSN (note: subdivide by different phases) ⇒ reconstruct within standard deviation except the recent 10 years. ⇒ change from 2004 is clear 5
Further sorting out by different SSN level Distribution of different Kp level (monthly averaged∑Kp/day) for given SSN range. Different colors (left) or panels (top) correspond to different solar cycles. 6
cf. probability of Kp≥5 (instead of average Kp) The graph for "probabilities of Kp≥5" (numbers of 3-h periods/ month) instead of "daily sum ∑Kp". 7
Summary & conclusions • Monthly-averaged Geomagnetic activities (K@65 GMLat and Kp@mid-latitude) for the same monthly sunspot numbers (SSN) are different between (a) different phases of a solar cycle & (b) different solar cycles. • If these differences are considered, it is possible to reconstruct 3-month averaged Kp from 3-month averaged SSN. • This "monthly averaged SSN-to-Kp response" depends on the amplitude of the solar cycle (peak SSN at maximum). In this sense, this relation during 1930's and 1960's are in between the most recent 10 years and the other period. • The extremely low "monthly averaged SSN-to-Kp response" of the current solar cycle started around January 2004. (but this & variation of general Sun-Earth coupling should be reexamined using actual solar wind data in future). 8
“Chance of minor storm@high-latitude” by NOAA vs. observed Kp (Anna Larsson, high-school student project) % of observed Kp (largest of the day) For the same prediction, Kp values are (model is different between 2000 ⇔ 2011): 2011-2012 < 2007-2008 & 2000-2001 < 2003-2004 9