Download
1 / 56
560 likes | 654 Views
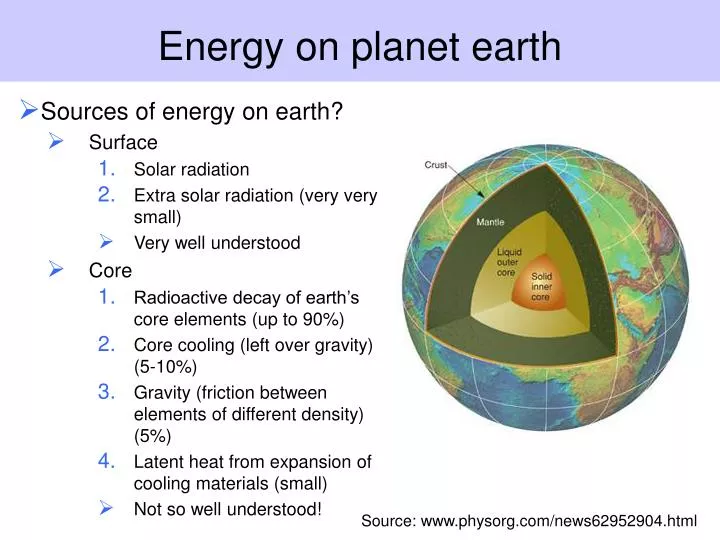
Energy on planet earth. Sources of energy on earth? Surface Solar radiation Extra solar radiation (very very small) Very well understood Core Radioactive decay of earth’s core elements (up to 90%) Core cooling (left over gravity) (5-10%)

E N D
Energy on planet earth • Sources of energy on earth? • Surface • Solar radiation • Extra solar radiation (very very small) • Very well understood • Core • Radioactive decay of earth’s core elements (up to 90%) • Core cooling (left over gravity) (5-10%) • Gravity (friction between elements of different density) (5%) • Latent heat from expansion of cooling materials (small) • Not so well understood! Source: www.physorg.com/news62952904.html
2 more obscure sources? • Earth’s rotation • Coriolis effect: trade winds and ocean currents • Moon • Tides
Thermhaline current “global conveyor belt” • Color key is NOT temperature!
Radioactive heating of earth’s core • Radioactivity involves the decay of unstable nuclei of atoms • In the earth’s core, these are mainly Uranium, Thorium and Potassium • Potassium is also the main source of human radioactive exposure • Earth core total heat generation estimated30 - 44 TW (1 TeraWatt = 1012 Watts) • Radioactive component measured in 2005 through antineutrino detection by KamLAND (Japan)24 TW • 10 TW = 1990 global fossil fuel use Sources: http://athene.as.arizona.edu/~lclose/teaching/a202/ NewScientist, July 27 2005
Radioactive decay chains Radioactive decay of heavier nucleiFrom http://commons.wikimedia.org
Some solar numbers Sun mass = 2 x 1030 kg = 333 thousand earth masses Sun radius = 7 x 10⁸ meters= 100 x earth’s radius Sun-Earth distance = 150 x 109 metersroughly 2000 x earth’s radius Density = 1.4 tonnes / cubic meter = 25% as dense as the earth Surface temperature = 5’778 KelvinEarth surface temp = 287 Kelvin (14 Celsius) Power radiated (Luminosity) = 3.85×1026 W
Solar radiation on earth • Total power radiated =3.85×1026 W • Power density at earth’s orbit = 1’367 W/m2 = SOLAR CONSTANT • Actually not a constant, increased by 30% over 3 billion years of life on earth! • Stability of climate during this time is one basis of Gaia hypothesis. • Average power density at earth upper atmosphere = 342 W/m2 • Because of earth is rotating sphere, divide solar constant by 4. • Reaching the ground: 240 W/m2 • Total 122 PW = 122 x 1015 Watts • Compared to 30-44 TW from earth core heating
Spectral qualities of solar radiation • Light (or radiation) is characterized by wavelength/frequency (colour) and intensity. • Spectrum is the shape of the intensity vs. wavelength • Wavelength and frequency are directly related to each other: wavelength = (speed of light) / frequency speed of light = 299’792’458 meters / second Higher frequency => higher energy Higher wavelength => lower energy • “Black body” radiation means the relation between the wavelength and the intensity are determined by the temperature of the radiating object alone • All objects at the same temperature have the same black body spectrum. • Solar spectrum is Black body radiation at 5800 Kelvin
Perfect black body The most perfect black body radiation ever measured:The cosmic microwave background radiation at 2.725 Kelvin = 1 / wavelength
= nanometer = 10-9 meter Source: http://en.wikipedia.org/wiki/Solar_radiation
BB 5800 K BB 300 K Source: Nasa ERBE
Global radiation flows Source: Smil, General Energetics
Uses for all this radiation • 300 Kelvin planet: water is liquid! • Visible light: energy which can be used by “autotrophs”
Solar radiation and core heat:Secondary phenomena & energy sources • Wind, tornadoes, hurricanes, jet streams (in part due to earth’s rotation) • Waves, ocean currents (in part due to earth’s rotation) • Tides (due to moon) • Earthquakes, volcanic eruptions, tsunamis • Global water cycle (rain, snow, rivers, glaciers, erosion) • Requires 40 PW (third of solar radiation) • Geothermal energy
Global water cycle flows Units: W/m2 (I think) Source: Smil, Energies
Global Wind Flows Source: Smil, Energies
Wind and extractable energy Power (Watts) Source: Smil, Energies
Thoughts on global energy processes • Small number of primary sources (sun, moon, rotation, core heat) • Energy is transferred and reused in many ways once it reaches the lithosphere-atmosphere • Movement of masses (tectonic plates, water, ice, crust, air) • Transfer of temperatures (water, absorption and re-radiation of light, volcanic eruptions and geothermal processes) • Sorting of matter based on density. • Life on earth is based on taking advantage these energy various energy flows.
Some biology vocabulary • Biomass: mass or energy of organisms (living or ex-living) per unit area of land or unit volume of water • Units J/m2 or tonne/hectare • Phytomass: plant biomass (stock) • Autotroph: organism which does not feed on other organisms, but relies on chemical, thermal or radiation energy in its environment: producers in the food chain • Plants, some bacteria • Heterotroph: organism which feeds on organic matter created by other organisms: consumer in the food chain • Everyone else • Primary production: rate of phytomass production • Units J/m2/day or tonne/hectare/year • Secondary production: rate of non-plant biomass production
Troph flow chart Yes No Carbon from CO2? Autotrophs Heterotrophs
Life on earth • When? 3.5 billion years ago (Archean era) • Sun & earth 5 billion years old … and another 5 billion to go. • Who? Prokaryotes Archaea: autotrophs • Lots of CO2 in atmosphere, sequestered to CaCO3 (limestone) • Inorganic geochemical processes? • Early life forms? • Missing in atmosphere? O2
Atmospheric composition Photosynthesis Source: Smil, Energies
Absorption of terrestrial radiation Peak of earthradiation at 300K Source: Smil, Energies
Photosynthesis: primary production • Plant input: Carbon dioxide + water + sunlight • CO2 + H2O + light • Plant output: Carbohydrate + oxygen + water • CH2O… + O2 + H2O • Carbon is “fixed” in plant, • providing food for heterotrophs • Oxygen is released intoatmosphere Why do plants do it?
CH4 Methane CO2 Carbondioxide Source: J. Siirola, GRC 2006
Carbon oxidation states, cont. Plants starthere And end here Decreasing energy availability
Efficiency of photosynthesis • Efficiency of photosynthesis = stored chemical energy / incident sunlight • Factors influencing efficiency • (1) Theoretical constraints • Only 43% of incident sunlight is Photosynthetically Active Radiation (PAR), wavelengths 400-700 nm • Chemical reaction efficiency of carbon assimilation is 90% • Quantum probability requirements of light per molecule 30% • Total theoretical efficiency = 12% • (2) Practical constraints • Light reflected from & transmitted through leaf surface 10-25% • Angle of leaf to sunlight is often not 90%, often not direct sunlight • Energy costs of respiration (40%), rapid rates of photosynthesis • Plant metabolic processes (maintenance, growth, reproduction) • Only get 50% - 2 % of best theoretical performance • Total photosynthetic efficiency is 6%, most often lower
Limiting factors of photosynthesis • Water availability • C3 and C4 photosynthesis • C4 in warmer, dryer climates • Nutrient availability • Managed ecosystems (agriculture) are more productive.
Primary production “Numerous intricacies of photosynthetic energetics remain unknown but certainly one of the most surprising weaknesses in our knowledge of life is our patchy understanding of phytomass stores and productivities. Our lack of satisfactory appraisal of photosynthesis on planetary and ecosystemic scales is more troubling than remaining gaps in our biochemical understanding.” Vaclav Smil, General Energetics: Energy in the Biosphere and Civilization, 1991
Accounting for primary production • Gross primary production GPP: total fixation of carbon by autotrophs (primary producers) • Autotrophic respiration RA: lost energy • Heterotrophic respiration RH • Total ecosystem respiration RE = RA + RH • Net Primary Production NPP: rate of production of new biomassNPP = GPP - RA • Net Ecosystem Productivity NEP = GPP – RE • NEP > 0 : Ecosystem is carbon sink • NEP < 0 : Ecosystem is carbon emitter
Trophic Model - Odum I = Input, ingested energy; NU = not used; A = assimilated energy; P = Production; R = Respiration; B = Biomass; G = Growth; S = Stored Energy; E = Excreted Energy Courtesy of Karlheinz Erb
Energy Flow through Ecosystems Courtesy of Karlheinz Erb
Ecological Parameters and Succession Courtesy of Karlheinz Erb
The Trophic System of different Ecosystems Courtesy of Karlheinz Erb
The Trophic Net Courtesy of Karlheinz Erb
NPP - Methods of Assessment short term harvest technique - harvest an area (quadrats) at short term intervals to get NPP: PN = B + D + C where D = death, C = consumption and B = Bt– Bt-1 Courtesy of Karlheinz Erb
NPP – Correlation with Climate Courtesy of Karlheinz Erb
ANPP of the World Ecosystems Courtesy of Karlheinz Erb
Human Appropriation of Net Primary Production - Components • NPP0: NPP of the potential vegetation (i.e. absence of human interference) • NPPact: NPP of the actual vegetation • NPPh: Harvest of NPP • NPPt: NPP remaining in ecosystem after harvest NPPt = NPPact - NPPh • HANPP = NPP0 – NPPt; NPPt/NPP0 [%] • HANPP = NPP0 – NPPact + NPPh Courtesy of Karlheinz Erb
Human Appropriation of Net Primary Production Courtesy of Karlheinz Erb
NPP and the Carbon Cycle Courtesy of Karlheinz Erb
The Global Carbon Cycle Courtesy of Karlheinz Erb
Heterotrophs • Heterotrophs eat, breathe, excrete and emit energy • Food: ingested, then absorbed or excreted • Energy costs for basal & active metabolism • Basal functions: temperature maintenance, organ function • Activity needed to capture food.
Basal metabolic rate: Kleibner’s w3/4 law Geometric considerations can explain the ¾: • diameter of limbs goes as mass3/8 • Power output of muscles goes as diameter2 • Power goes as mass3/4 70 kg Source: Smil, General energetics
BMR of humans kcal / day 80 W 50 W (Harris & Benedict, 1919)
BMR by organ Source: Durnin 1981 http://www.fao.org/DOCREP/MEETING/004/M2845E/M2845E00.HTM
Human food energy requirements Smil, Energies